
There are no magic bullets, but we can improve our trading edge by starting our selection process with two proven concepts: trend and momentum. These are perhaps the two most powerful forces in the market. The idea is relatively simple: stay on the right side of the trend and focus on the leaders. This is basically dual-momentum. Starting our process with these two steps will increase the odds of success. We will first choose the timeframe and then select two indicators.
When it comes to trend-momentum strategies, my research suggests that longer timeframes work better than shorter timeframes. This means 200 days works better than 50 days. Short timeframes, such as 20 and 50 days, are better suited for mean-reversion strategies, which trade pullbacks within uptrends. 200 days covers around nine months. This is long enough to absorb a 2-3 month correction and short enough to allow for extended trends.
Next, we need a trend-following indicator. While there are dozens of options out there, a simple 200-day SMA works quite well for long-term trend identification. The idea is to filter out stocks that are in downtrends and only focus on stocks in uptrends (above their 200-day SMAs). Negative outcomes are more likely when below the 200-day SMA and positive outcomes are more likely when above. It is as simple, and effective, as that.
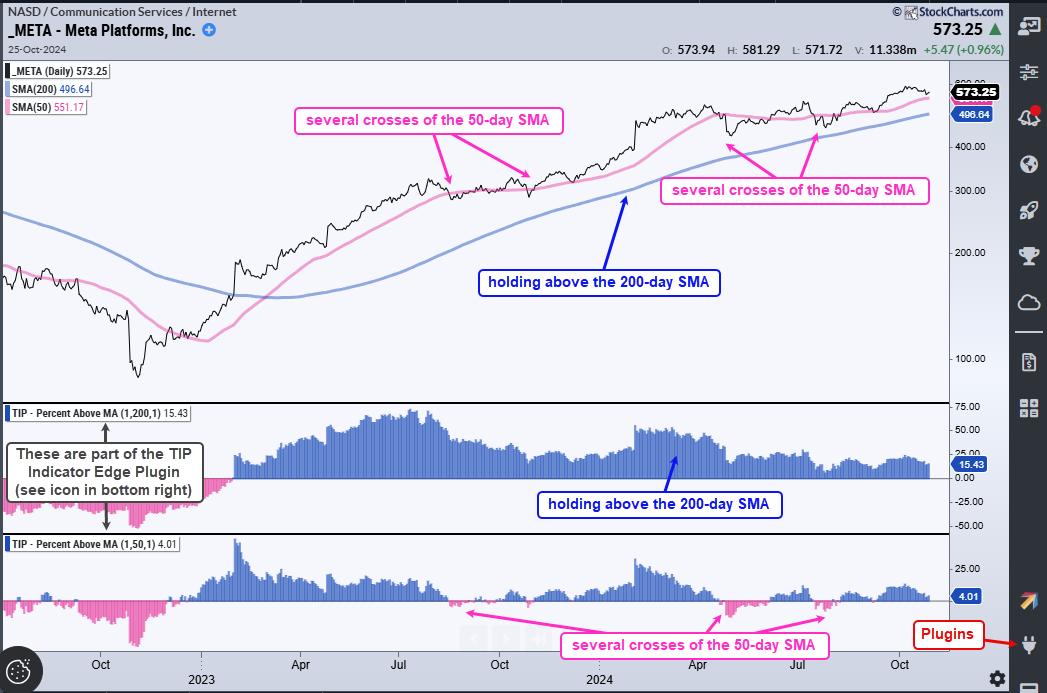
The chart above shows META with the 50 and 200 day SMAs. In the indicator windows, we can see the Percent above MA indicators, which show the distance between the close and the moving average. META broke the 50-day SMA several times, but none of these breaks resulted in a trend reversal. These breaks simply marked tradable pullbacks within the bigger uptrend. It would have been more profitable to accumulate on breaks of the 50-day as the stock held the 200-day and extended higher.
After filtering for stocks in uptrends, we then need a momentum indicator to quantify performance. Here again we have dozens of choices. Rate-of-Change is the purest momentum measure and also works quite well. As with the SMA, I will use the 200-day Rate-of-Change to capture long-term performance. We can then rank stocks and focus on those with the strongest momentum.
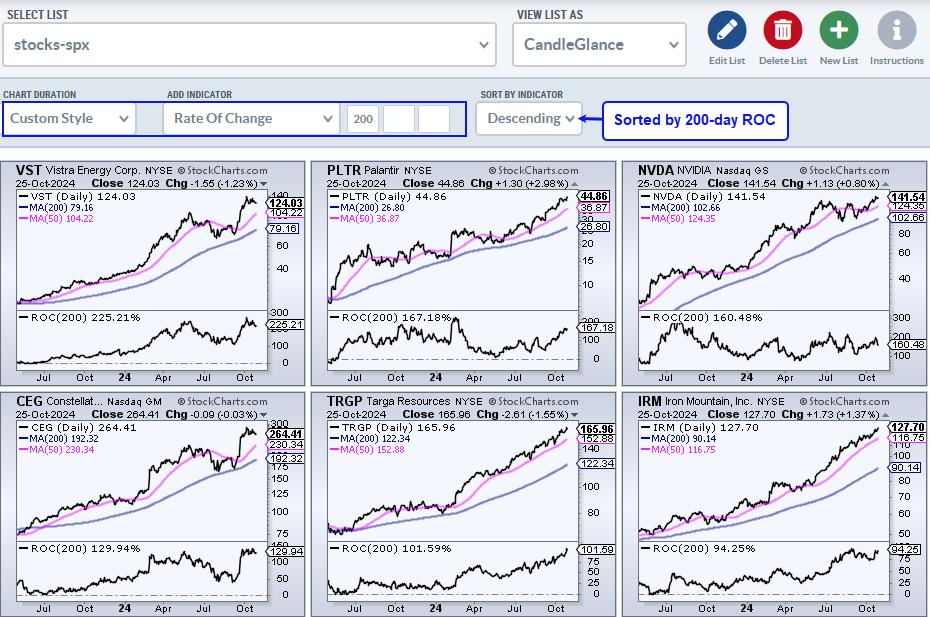 The CandleGlance charts above show the top performing S&P 500 stocks. I created a ChartList with S&P 500 stocks, viewed the list as CandleGlance and sorted by the ROC(200). This puts the top performing stocks at the top and I can then scroll through this list to create a short-list for further analysis.
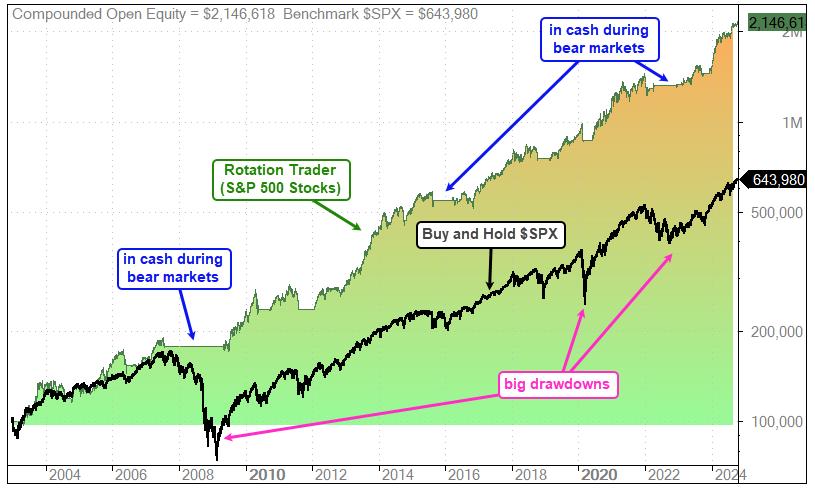
This coming week at TrendInvestorPro we are introducing two new rotation strategies using variations of these concepts. These strategies are fully systematic and trade once per week. They are aimed at investors because they trade less frequently than our rotation trader strategies. Note that our S&P 500 rotation trader strategy is up over 40% in 2024. The image below shows the equity curve for this strategy (green line) and buy-and-hold for the S&P 500 (black line). This strategy is up more than 3 times buy-and-hold and the drawdowns are much lower because of the market regime filter. Click here to learn more.
Systematic Strategies at TrendInvestorPro
Rotation Trader for S&P 500 Stocks (+43% in 2024)
Rotation Trader for Nasdaq 100 Stocks (+17% in 2024)
Rotation Investor for S&P 500 Stocks (debuting next week)
Rotation Investor for Nasdaq 100 Stocks (debuting next week)
Click here to learn more and get two bonus reports.
/////////////////////////////////////