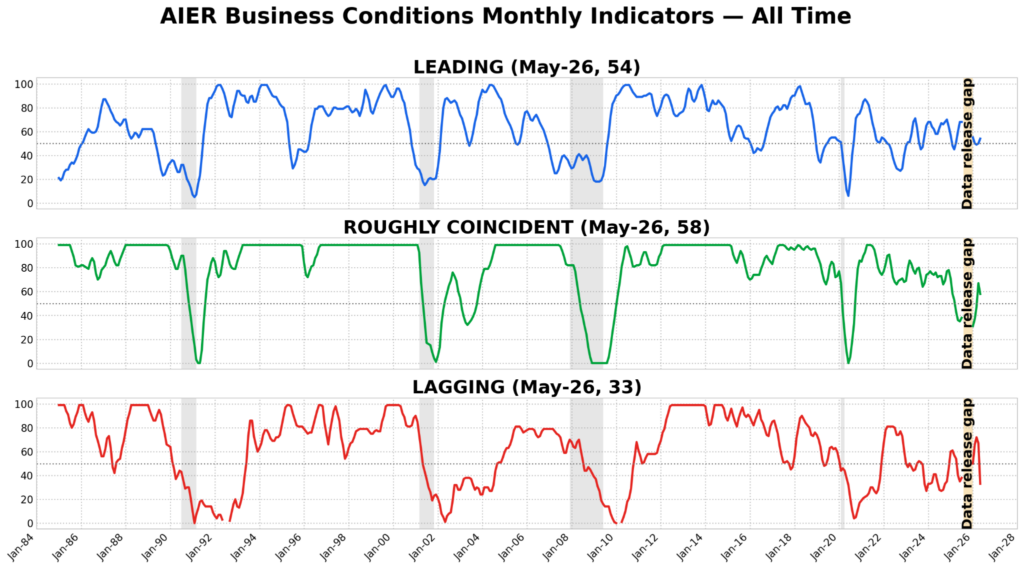
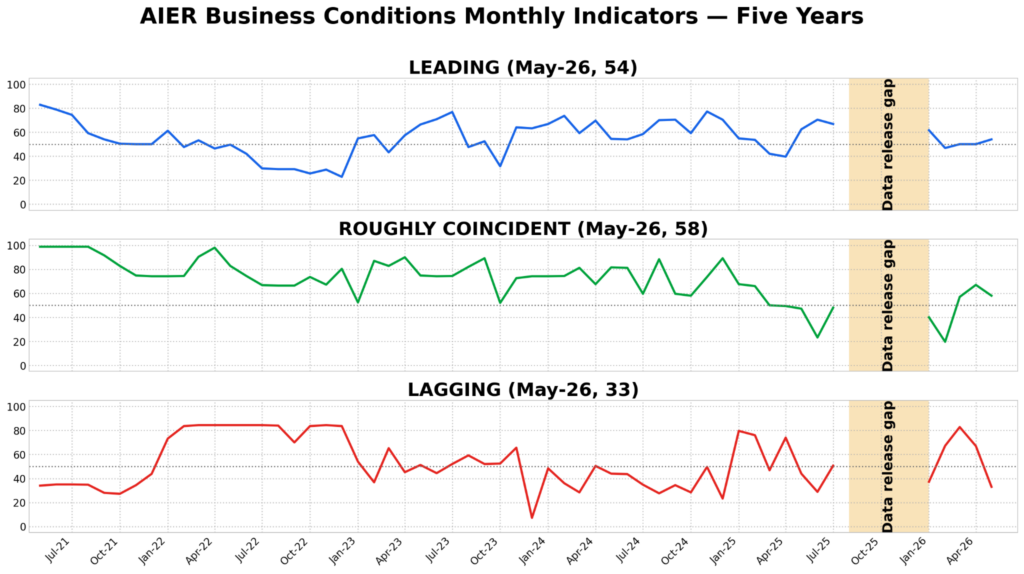
The May 2026 AIER Business Conditions Monthly (BCM) points to an economy that remains mixed, with a modest improvement in forward-looking breadth, a softer read on current activity, and a clear deterioration in lagging conditions. The Leading Indicator rose to 54 from 50, moving slightly above neutral after last month’s evenly split reading. The Roughly Coincident Indicator declined to 58 from 67, suggesting that current activity remains positive but less broadly firm than in April. The Lagging Indicator fell sharply to 33 from 67, indicating that slower-moving measures weakened meaningfully after last month’s more expansionary reading.
LEADING INDICATOR (54)
The Leading Indicator came in at 54, with six of 12 components improving, one essentially unchanged, and five declining.
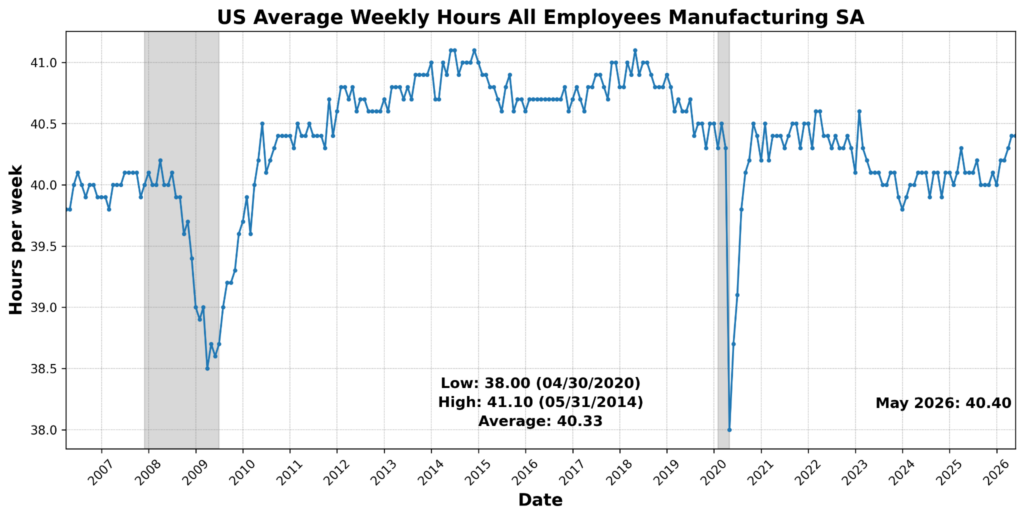
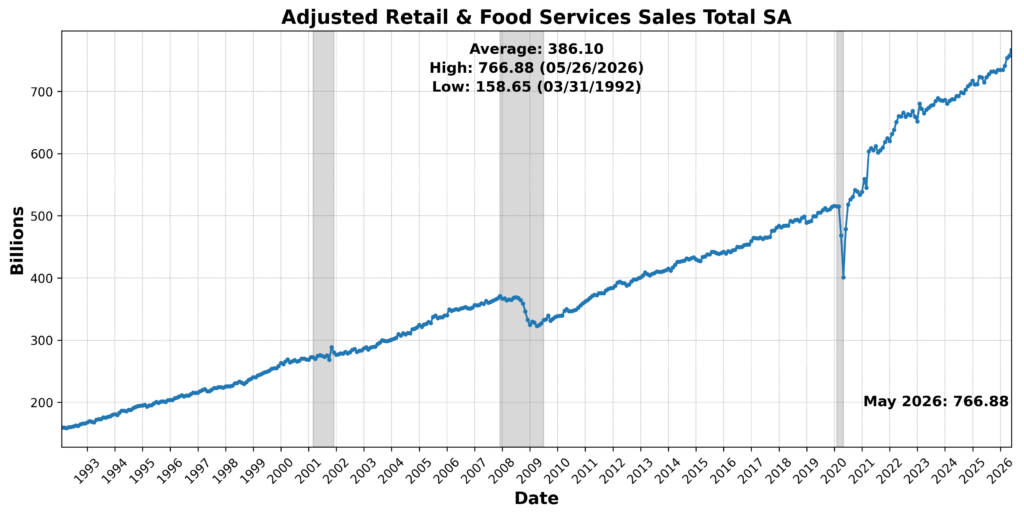
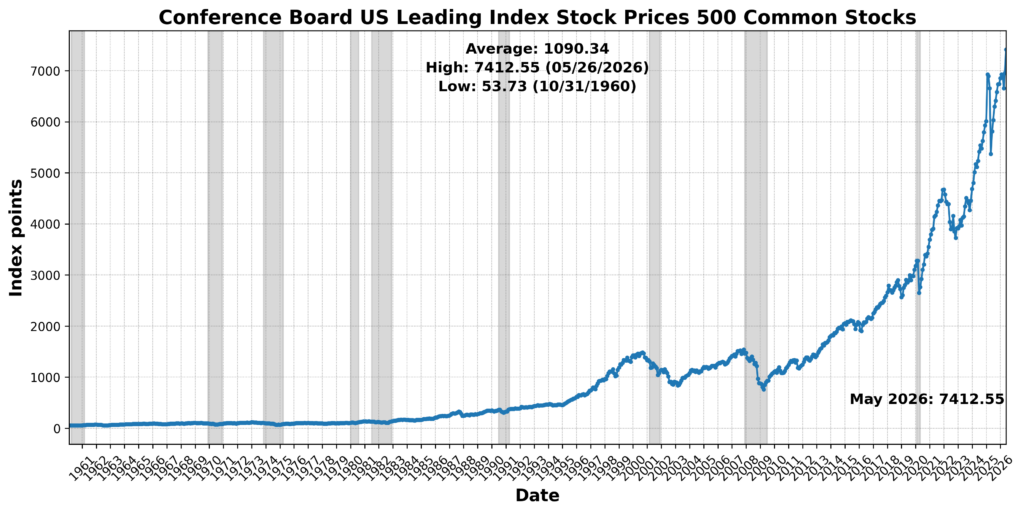
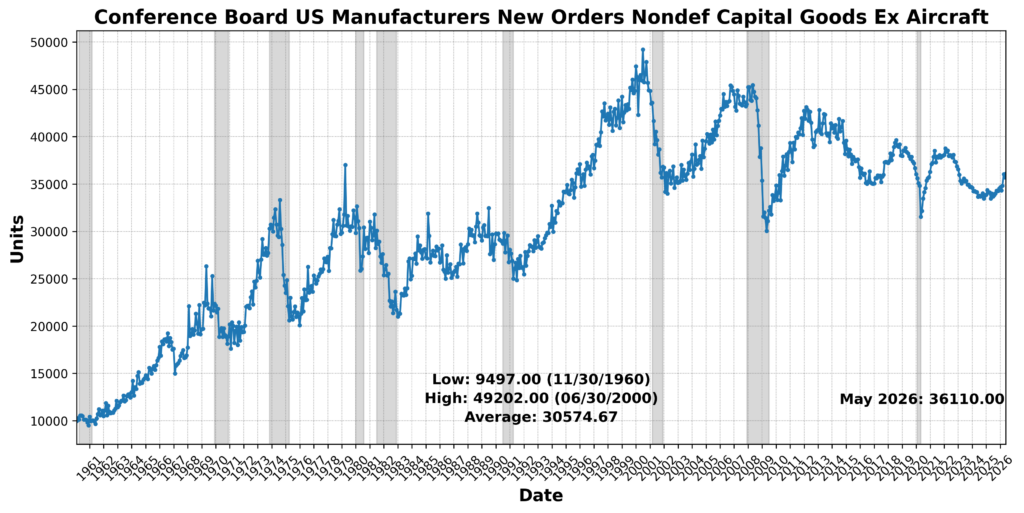
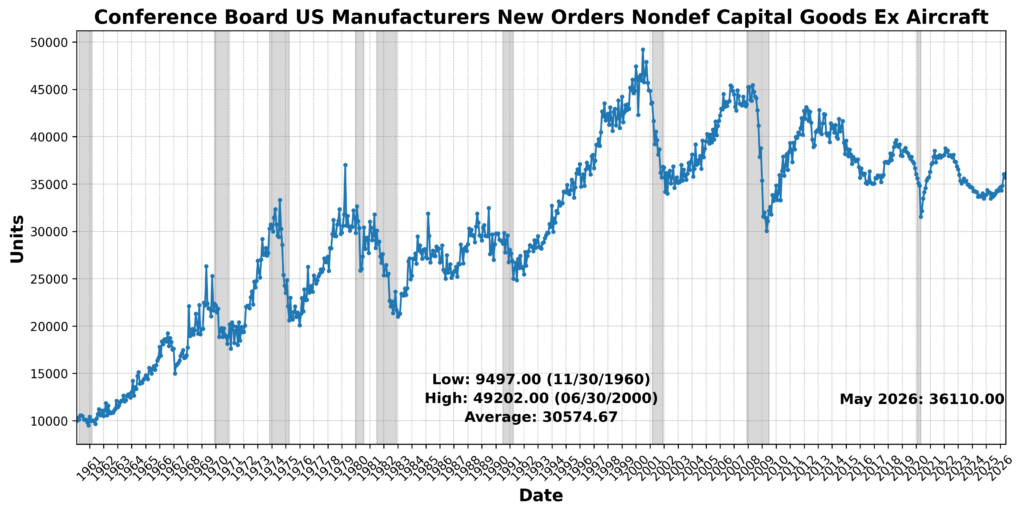
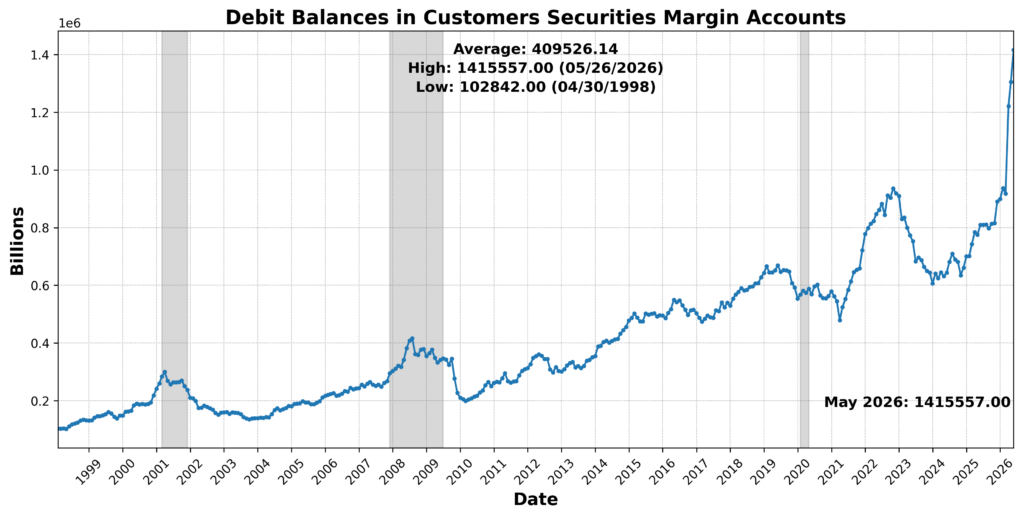
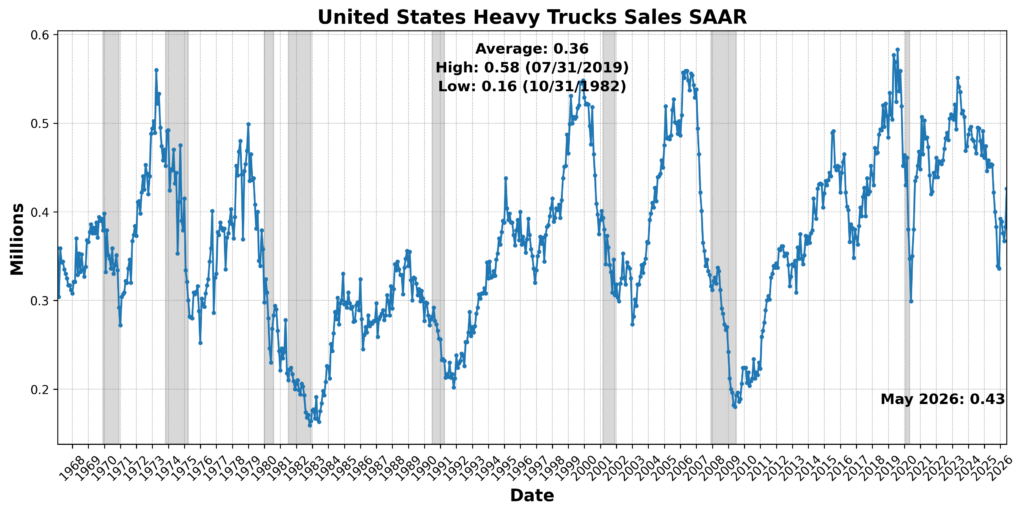
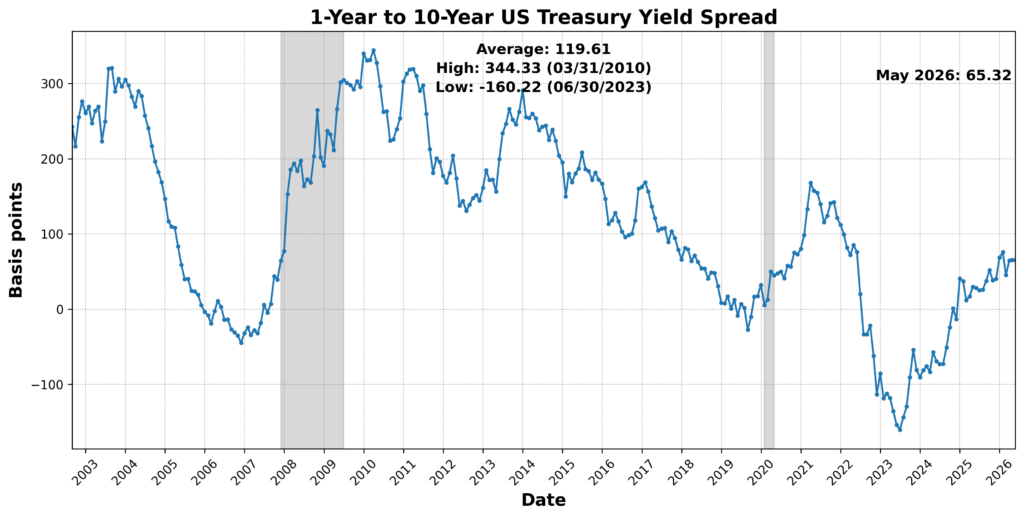
Positive contributions came from a mix of financial-market, demand-sensitive, orders, and yield-spread measures. The Conference Board US Leading Index Stock Prices 500 Common Stocks rose 6.5 percent, while Conference Board US Manufacturers New Orders Nondefense Capital Goods Ex Aircraft increased 1.1 percent. Adjusted Retail and Food Services Sales Total SA advanced 1.3 percent, United States Heavy Trucks Sales SAAR rose 11.2 percent, and Debit Balances in Customers’ Securities Margin Accounts increased 8.5 percent. The 1-Year to 10-Year US Treasury Yield Spread narrowed 0.3 percent and was scored positively after inversion. US Average Weekly Hours All Employees Manufacturing SA was effectively unchanged, contributing neutrally.
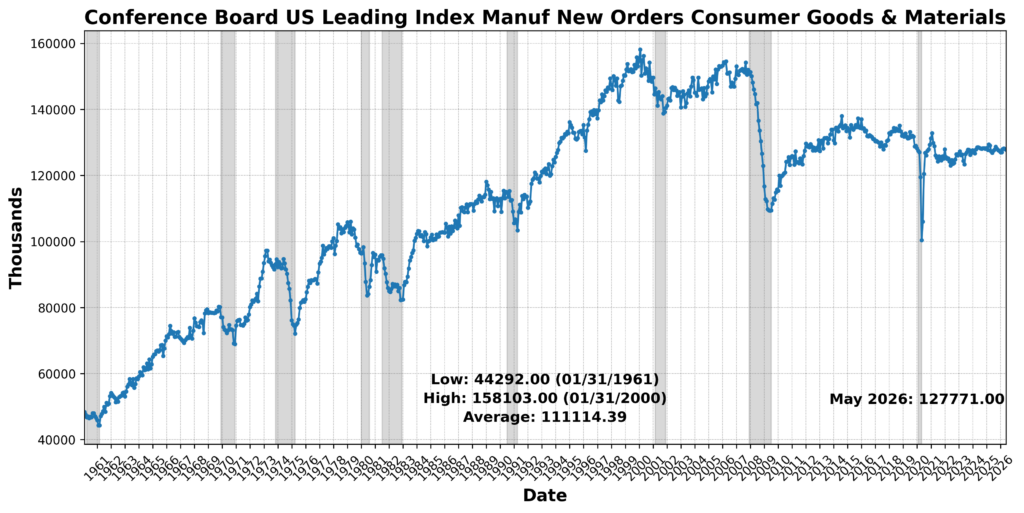
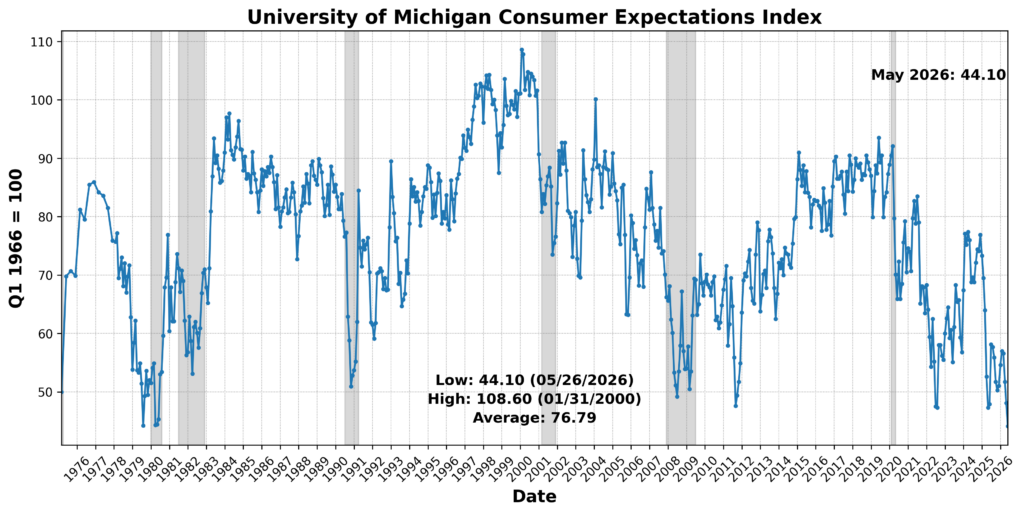
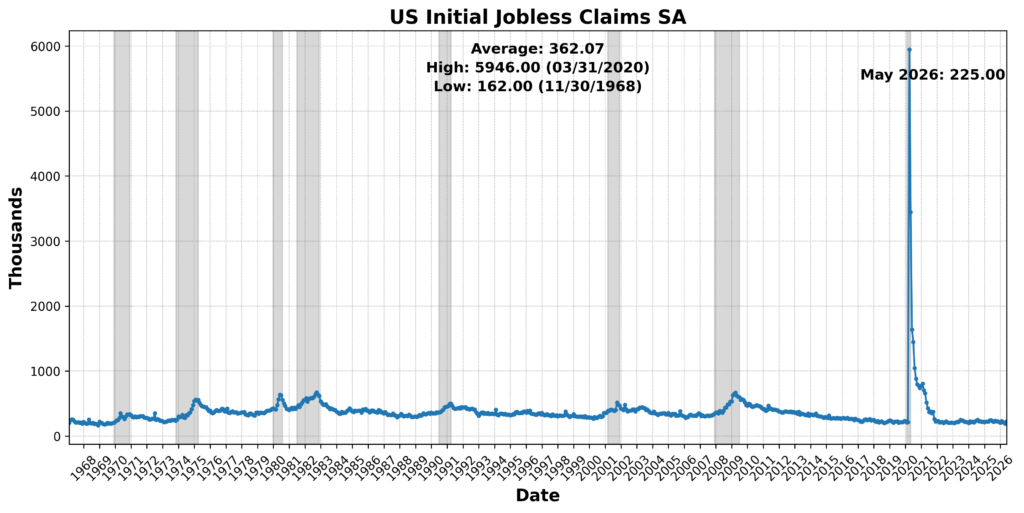
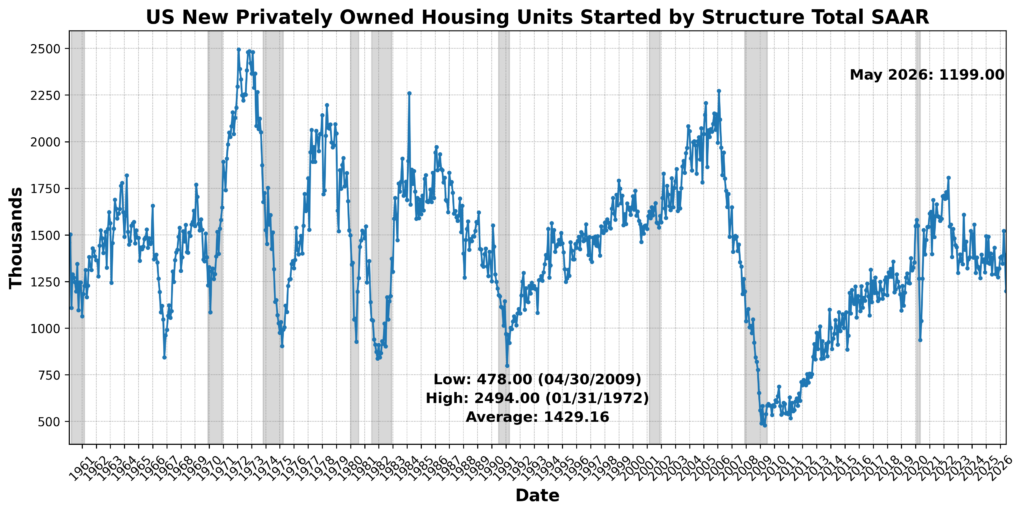
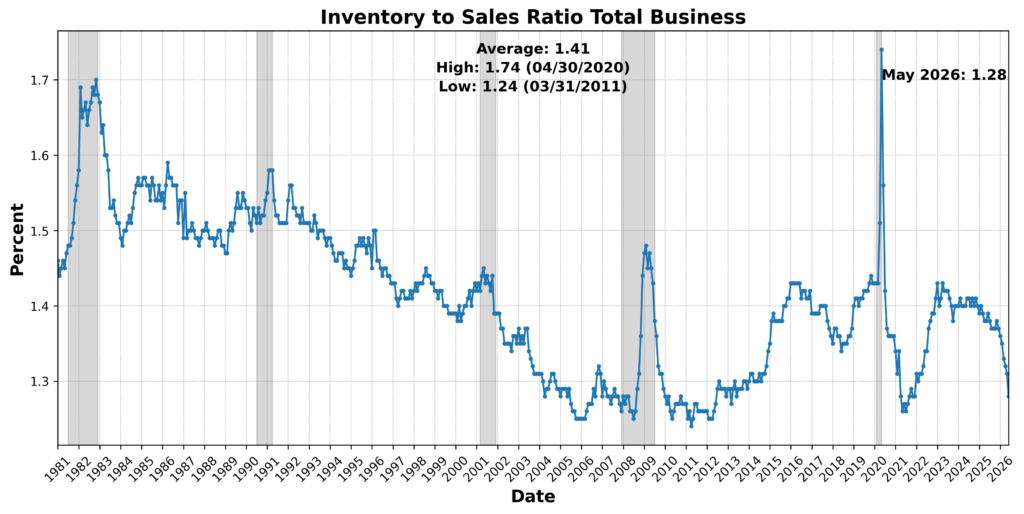
Those gains were offset by weakness in several important forward-looking areas. The University of Michigan Consumer Expectations Index fell 8.3 percent, pointing to another deterioration in household expectations. US Initial Jobless Claims SA rose 18.4 percent and was scored negatively after inversion. Conference Board US Leading Index Manufacturers’ New Orders Consumer Goods and Materials slipped 0.2 percent, while US New Privately Owned Housing Units Started by Structure Total SAAR dropped 13.9 percent. The Inventory-to-Sales Ratio Total Business declined 2.3 percent and, under the BCM scoring approach, was scored negatively.
Taken together, the leading components suggest a forward-looking environment that improved modestly but remains divided]. Equity prices, capital goods orders, retail activity, heavy truck sales, margin debt, and the yield-spread signal provided support, while consumer expectations, initial claims, consumer-goods orders, housing starts, and inventories restrained the index. The rise from 50 to 54 points to a slightly better leading picture than in April, but not a decisive or broad-based acceleration.
ROUGHLY COINCIDENT INDICATOR (58)
The Roughly Coincident Indicator registered 58, with three of six components improving, one essentially unchanged, and two declining.
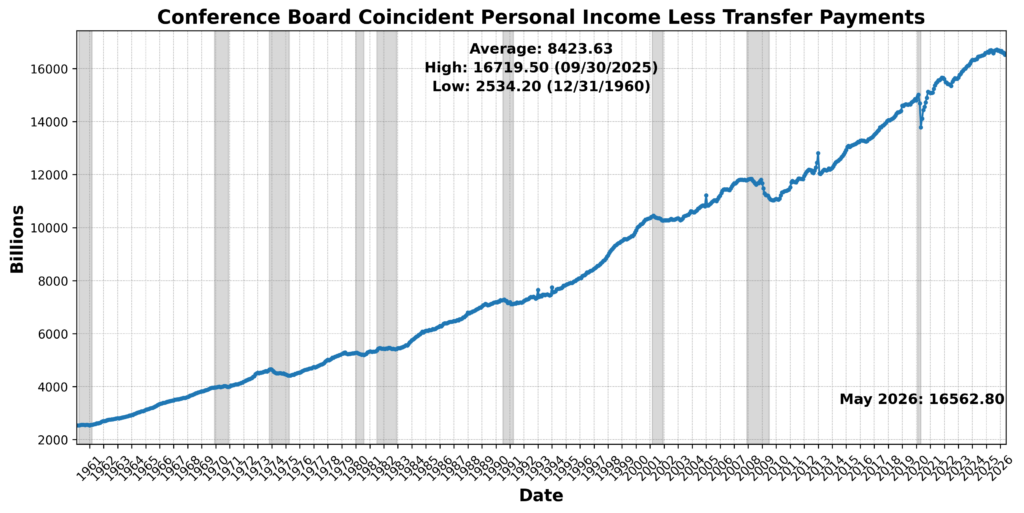
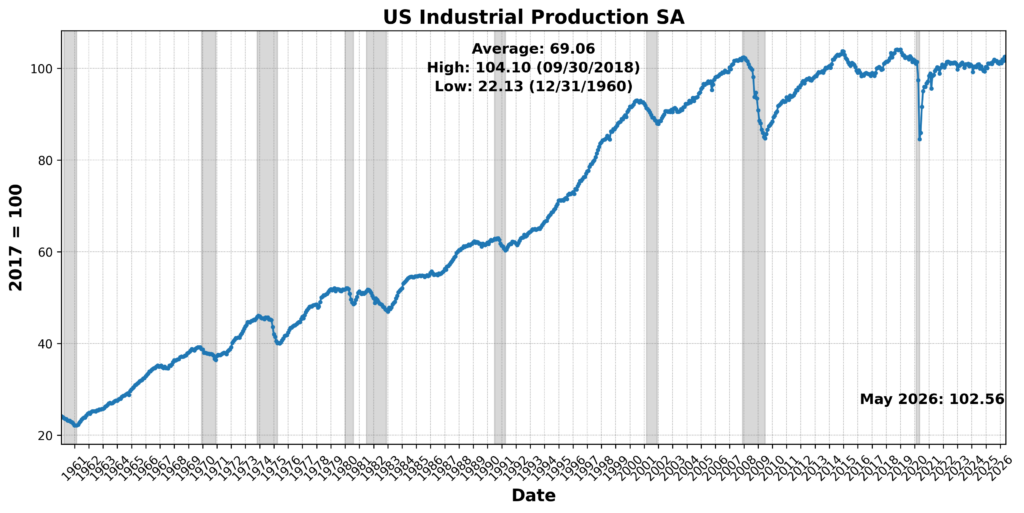
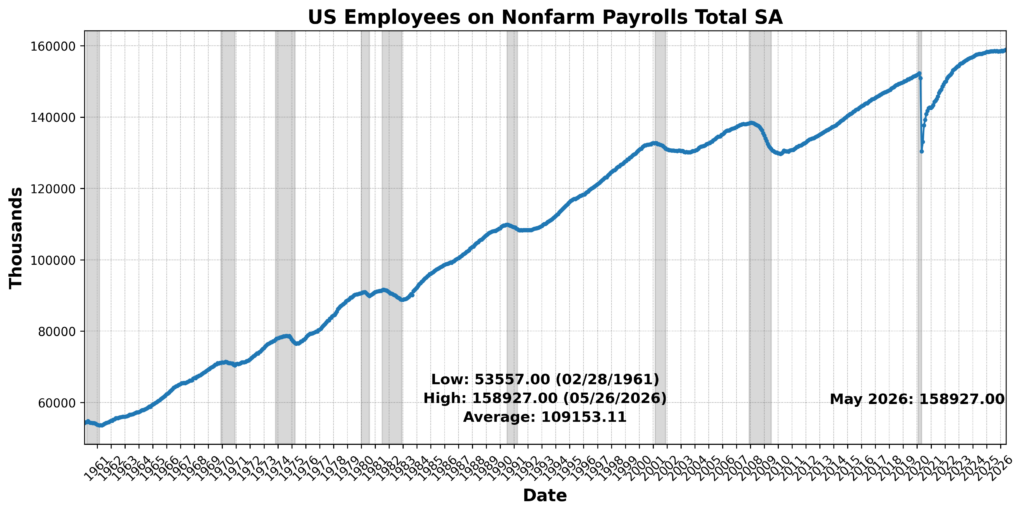
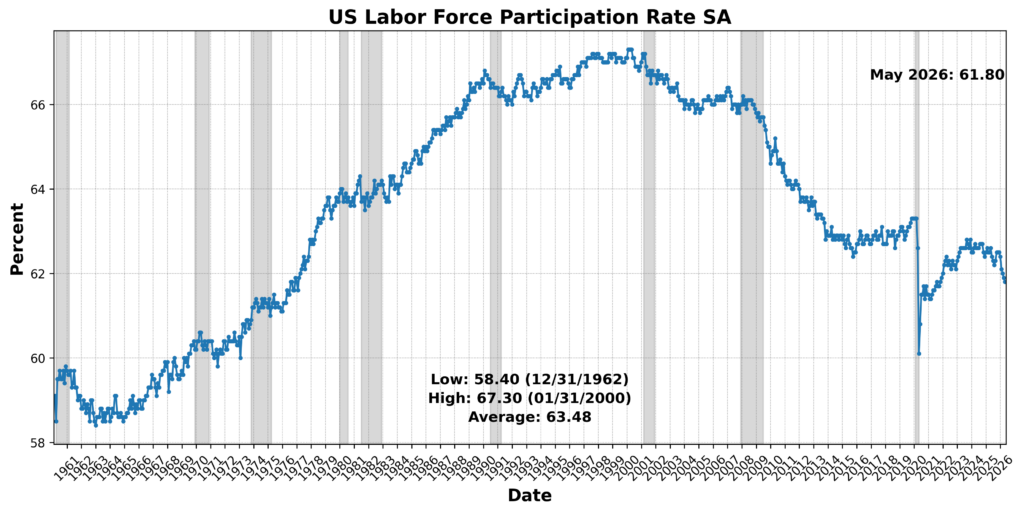
Current activity remained modestly positive, though less uniformly strong than in April. Conference Board Coincident Personal Income Less Transfer Payments rose 0.3 percent. US Industrial Production SA edged up 0.1 percent, and US Employees on Nonfarm Payrolls Total SA also increased 0.1 percent. The US Labor Force Participation Rate SA was effectively unchanged and therefore contributed neutrally.
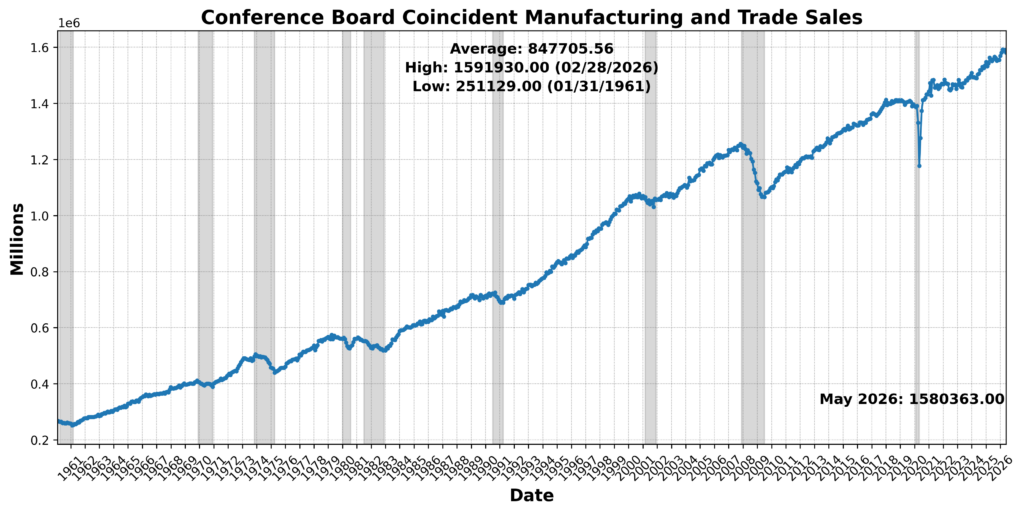
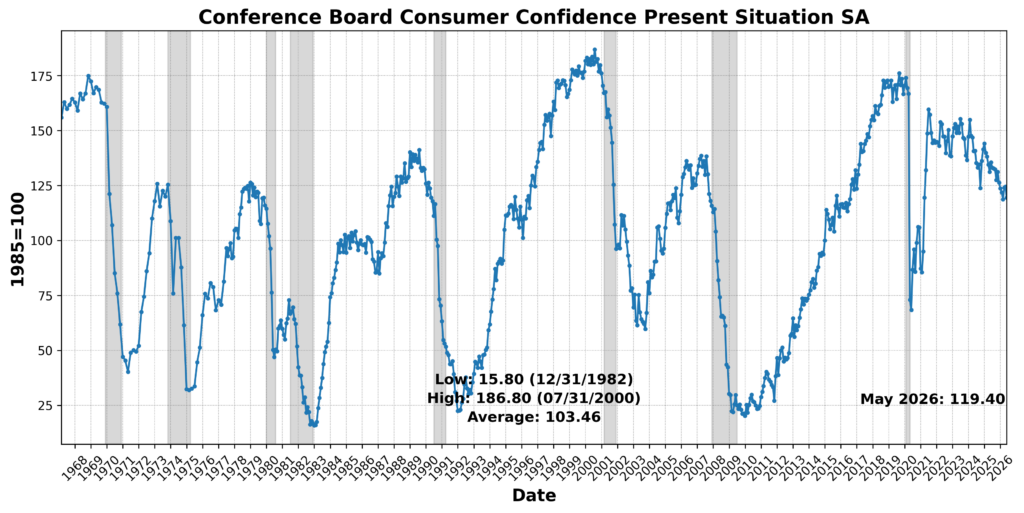
Two components weakened. Conference Board Coincident Manufacturing and Trade Sales declined 0.7 percent, and Conference Board Consumer Confidence Present Situation SA fell 4.0 percent. Those declines suggest that while income, production, and payrolls continued to advance, sales activity and present-situation sentiment softened during the month.
Overall, the roughly coincident data point to continued expansion in current conditions, but with less breadth than in April. The decline from 67 to 58 reflects a cooling in real-time activity rather than a broad contraction. Payrolls, income, and industrial production remained supportive, while weaker manufacturing and trade sales and softer present-situation confidence pulled the index lower.
LAGGING INDICATOR (33)
The Lagging Indicator stood at 33, with two of six components improving and four declining.
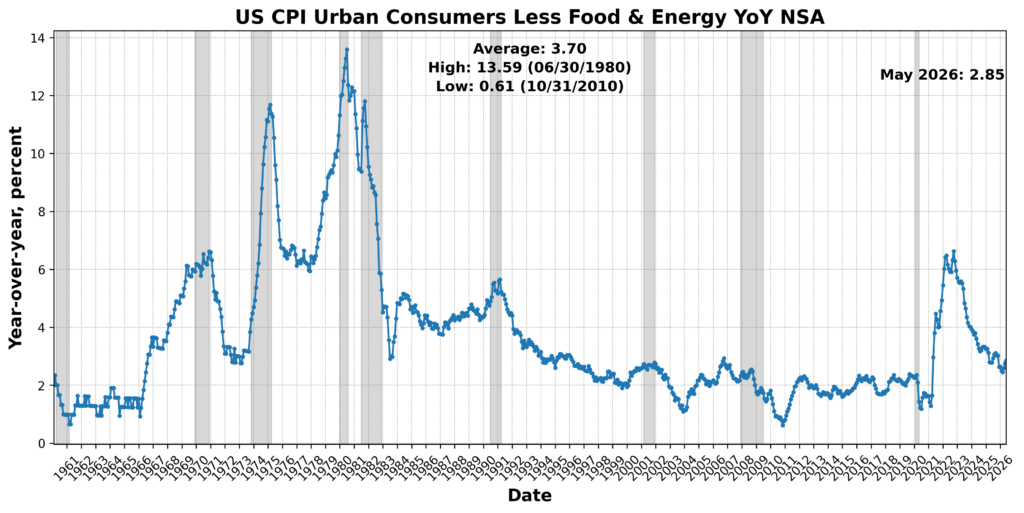
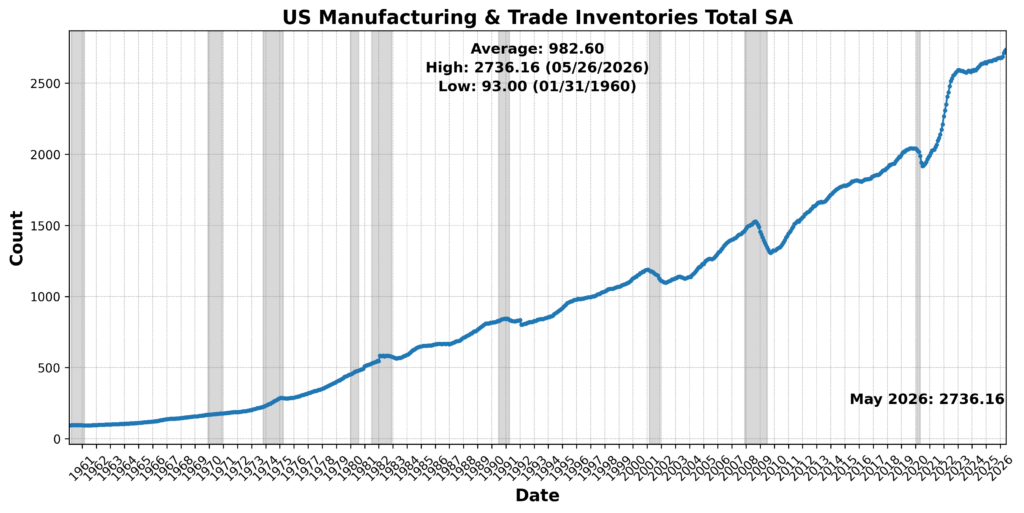
Two slower-moving measures contributed positively. US CPI Urban Consumers Less Food and Energy Year over Year NSA rose 3.7 percent, and US Manufacturing and Trade Inventories Total SA increased 0.4 percent. Those readings provided support from inflation and inventory measures.
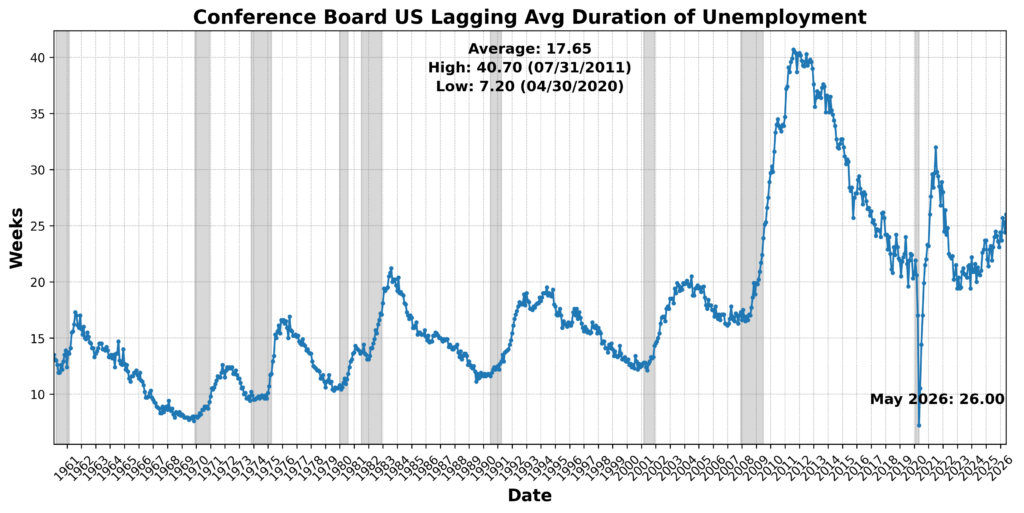
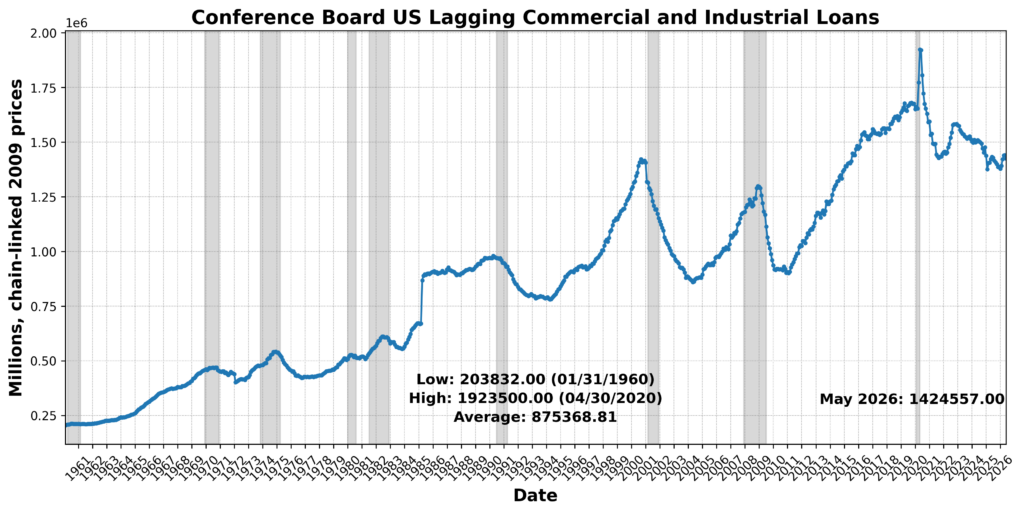
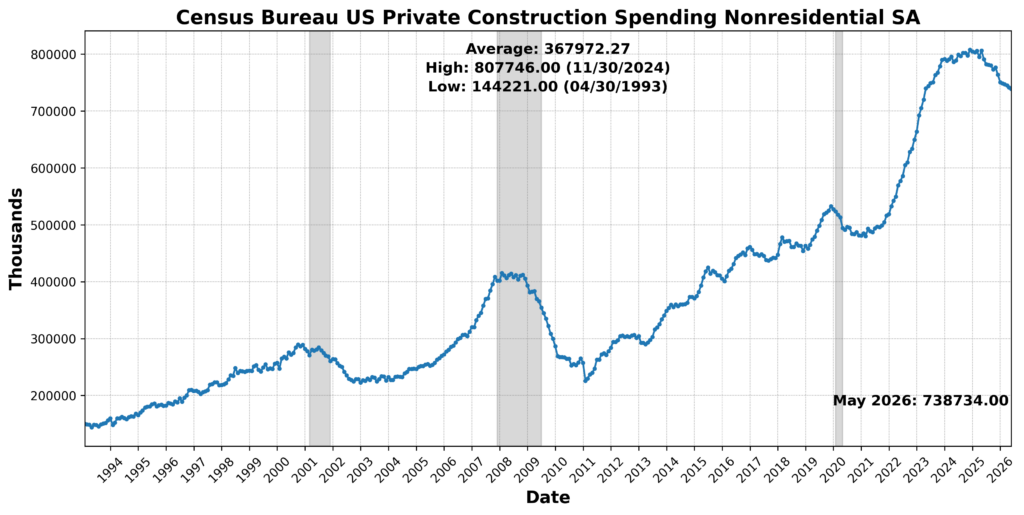
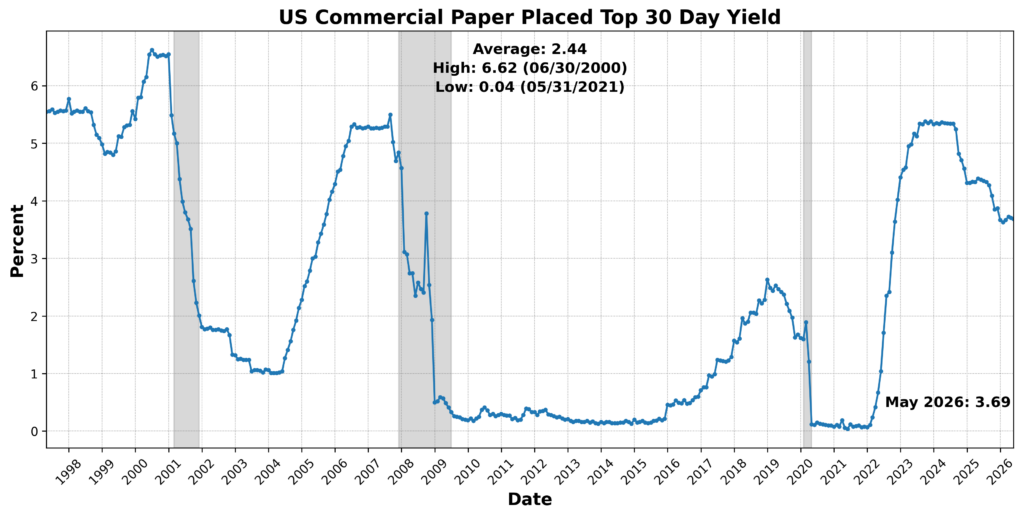
The remaining components weakened. US Commercial Paper Placed Top 30 Day Yield declined 0.4 percent and was scored negatively. Conference Board US Lagging Average Duration of Unemployment increased 6.6 percent and was scored negatively after inversion. Conference Board US Lagging Commercial and Industrial Loans declined 1.1 percent, and Census Bureau US Private Construction Spending Nonresidential SA slipped 0.3 percent. Together, those moves point to softer trailing conditions across short-term credit yields, unemployment duration, commercial lending, and nonresidential construction.
The lagging data deteriorated meaningfully in May. The drop from 67 to 33 suggests that much of the residual strength visible in April’s backward-looking measures faded during the month. While core inflation and inventories remained positive contributors, the broader lagging category turned contractionary, with weakness concentrated in credit, labor-market duration, lending, and construction-related measures.
May’s BCM results describe an economy that is still mixed, but less comfortably balanced than in April. Relative to April, the story is one of modestly better leading conditions, softer coincident momentum, and a sharp weakening in trailing measures — not a broad rollover, but a less reassuring mix than last month.
DISCUSSION (June/July 2026)
Recent inflation data point to a sharp improvement in headline price pressures, but a less decisive easing in the underlying measures most relevant to the Federal Reserve. June’s CPI was substantially softer than expected, with headline prices falling 0.4 percent as gasoline dropped nearly 10 percent, while core prices were essentially unchanged and year-over-year core inflation slowed to 2.6 percent. The improvement extended well beyond energy: shelter inflation moderated, medical services and car insurance declined, airfares barely increased, discretionary services cooled, and core goods prices fell for a second consecutive month, suggesting that most tariff-related passthrough has already occurred and that consumers are increasingly resisting further price increases. The breadth of inflation also narrowed considerably, with fewer than half of core categories rising at annualized rates above the Fed’s 2 percent target. Producer prices reinforced the near-term disinflationary signal, as headline PPI fell 0.3 percent on cheaper gasoline, lower transportation costs, and subdued services inflation, while portfolio-management fees and airfare — important inputs into the Fed’s preferred PCE index — came in below expectations. Upstream pressures have not disappeared, however: core PPI remains elevated from a year earlier, manufacturing inputs are still rising, freight costs remain high, and healthcare prices strengthened. Moreover, May’s PCE report showed that inflation had accelerated before the June energy reversal, with core PCE reaching 3.4 percent as portfolio fees, air travel, and healthcare accounted for much of the increase, while strong income growth and resilient consumer spending reduced the urgency of monetary easing. Taken together, the reports suggest that May likely marked the peak in headline inflation and that lower energy prices, softer goods prices, cooling shelter, and weaker pricing power are restoring disinflation, but persistent service sector and producer side pressures will allow the Fed to maintain a hawkish posture while leaving interest rates unchanged through the remainder of the year.
Recent labor market data continue to portray an economy that is cooling gradually rather than deteriorating abruptly. June’s employment report showed payroll growth slowing to 57,000, with downward revisions to prior months and a narrower breadth of hiring, yet the three-month average remains above most estimates of the pace needed to stabilize unemployment. The decline in the unemployment rate was less encouraging than it appeared, reflecting a sharp drop in labor-force participation — including a notable decline among prime-age workers — rather than stronger hiring, while wage growth remained modest and consistent with easing inflation pressures. Job creation continues to be concentrated in higher skill service industries such as healthcare, professional services, and finance, while consumer-facing sectors including leisure, hospitality, retail, and information weakened. Other labor indicators present a somewhat firmer picture: ADP payrolls and the May JOLTS report point to steady hiring, low layoffs, stable quits, and job openings that remain sufficient to support continued expansion without generating significant wage inflation. At the same time, early evidence suggests artificial intelligence may be beginning to reshape hiring patterns, with employment softening in technology, information, and financial activities through slower hiring and attrition rather than widespread layoffs. Taken together, the labor market appears neither overheated nor recessionary: hiring is moderating, labor demand remains generally healthy, wage pressures are contained, and the combination of softer employment growth and subdued inflation should leave the Federal Reserve comfortable remaining on hold while monitoring whether the recent cooling proves temporary or marks the beginning of a more sustained slowdown.
June’s purchasing manager surveys point to continued but moderating expansion across both manufacturing and services, with demand still solid, supply conditions improving, and cost pressures easing from their recent war-driven peak. The ISM manufacturing index slipped to 53.3 but remained near a four-year high and marked a sixth consecutive month of growth, supported by capital investment tied to artificial intelligence, defense spending, inventory accumulation, and strength across most industries. New orders and production slowed, however, employment remained slightly contractionary, backlogs grew at their weakest pace of the year, and factory commentary stayed cautious amid tariffs, elevated metals costs, stretched lead times, weaker consumer demand, and lingering uncertainty surrounding the Middle East. The most encouraging development was a sharp decline in the prices-paid index as falling oil prices relieved pressure on energy-intensive inputs, although overall costs remain well above early-year levels. Services activity followed a similar pattern: the ISM services index eased to 54.0 as new orders and production decelerated following May’s inventory buildup, but the sector continued to expand, export orders and backlogs strengthened, supplier performance improved, and employment increased. Taken together, the surveys suggest that the economy retains considerable momentum but is shifting toward a slower and better-balanced expansion, with firms still investing and hiring selectively even as demand visibility weakens, inventories rise, and producers remain wary of tariffs, geopolitical disruptions, and persistent input-cost pressures.
Measures of consumer and small-business sentiment improved in early summer, reflecting lower energy prices and growing confidence that economic conditions are stabilizing, though both households and firms remain cautious about inflation and geopolitical risks. The University of Michigan’s preliminary July consumer sentiment index rose to its highest level since February as falling gasoline prices eased pressure on household budgets, inflation expectations moderated, and buying conditions for major durable goods improved. Even so, concerns about the cost of living remained widespread, and because most survey responses were collected before renewed US military action against Iran pushed oil prices higher, some of July’s improvement may prove temporary. Small businesses likewise became more optimistic, with the NFIB Small Business Optimism Index posting its strongest reading of the year as better sales expectations, stronger hiring intentions, and increased capital spending plans pointed to firmer momentum heading into the second half of 2026. Uncertainty surrounding investment decisions declined, supply chain disruptions eased modestly, and hiring plans returned to their long-run average, although labor shortages and inflation remained the most frequently cited obstacles. Taken together, the surveys suggest that lower energy costs have materially improved economic confidence across households and businesses, but persistent inflation concerns, labor constraints, and the risk of renewed energy-price shocks continue to temper the outlook.
The FIFA World Cup appears to have provided a meaningful, if temporary, boost to US consumer spending in June, with its effects likely to become more evident in the Bureau of Economic Analysis’ personal spending report due July 30. Host cities experienced stronger restaurant traffic, as reflected in OpenTable reservation data, while retailers also benefited: Amazon moved its Prime Day promotion into late June to coincide with heightened consumer engagement during the tournament, supporting online merchandise sales. The event also fueled unprecedented sports betting activity, with more than $5 billion wagered through prediction markets such as Polymarket and Kalshi, record June betting volumes in New Jersey, and sharp increases in wagering in New York. However, that surge may not translate into stronger measured consumer spending because the BEA records gambling expenditures as net gaming revenue rather than total wagers, and early state data suggest casino and sportsbook revenues softened despite higher betting volumes. Taken together, the World Cup likely lifted June consumption primarily through hospitality and retail spending rather than gaming, contributing to an estimated 0.4 percent increase in nominal personal spending (roughly 0.5 percent in real terms) while providing a modest but noticeable tailwind to overall consumer demand.
Building on signs of resilient consumer demand, June’s industrial production report painted a somewhat softer picture on the supply side, although it appears weaker than many other indicators would suggest. Industrial output rose just 0.1 percent, with factory production essentially flat as declines in most durable-goods industries offset gains in computers and electronics, household appliances, transportation equipment, and several nondurable categories including food, apparel, printing, and energy products. Business equipment production weakened, though oil and gas drilling and utility output continued to expand. The report stands in contrast to stronger ISM manufacturing surveys, improving manufacturing employment, and other measures pointing to healthier factory activity, suggesting that June’s production figures may understate underlying momentum rather than signal a meaningful deterioration. Even so, while continued investment in artificial intelligence, defense, and industrial infrastructure should support demand for capital goods and durable manufacturing over the coming months, the evidence still falls well short of indicating the broad-based manufacturing renaissance that some observers have anticipated.
The Federal Reserve’s latest Beige Book largely reinforced the picture emerging from recent economic data: growth continues at a modest pace, inflation pressures are gradually easing, and policymakers have little reason to alter their current stance. Business contacts across most districts reported slightly improved sentiment, supported by lower fuel prices, resilient consumer spending, including a boost from World Cup-related tourism in some regions, and continued strength in manufacturing tied to artificial intelligence, data centers, machinery, and defense. Labor markets remained generally healthy, with employment expanding modestly despite persistent shortages of skilled workers in technical and trade occupations. Price pressures also moderated, as every district reported inflation that was either unchanged or slower than in the previous survey, although expectations for future inflation remained mixed amid uncertainty surrounding energy markets and geopolitical developments. Overall, the Beige Book suggests an economy that continues to expand without significant overheating, providing further support for the Federal Reserve’s strategy of maintaining a cautious, mildly hawkish posture while leaving interest rates unchanged as it awaits clearer evidence that inflation is moving sustainably back toward target.
Attention now shifts to the July FOMC meeting, where officials are widely expected to leave interest rates unchanged despite lingering concerns over inflation and renewed geopolitical risks stemming from the lengthening and increasingly unpredictable conflict with Iran. While softer June inflation data and easing energy costs before the latest oil price rebound strengthen the case for patience, policymakers are also likely to scrutinize incoming GDP, personal spending, Core PCE, employment costs, and consumer confidence data for evidence that resilient consumer demand and continued AI-driven investment are not rekindling underlying inflationary pressures. The result is a policy outlook that remains finely balanced: the Fed appears comfortable staying on hold for now, but is unlikely to signal an imminent easing cycle until disinflation becomes more firmly established.
In the aggregate, recent economic data suggest the US economy continues to expand at a moderate, more sustainable pace rather than sliding toward recession. Inflation is easing, labor markets remain resilient despite slower hiring, and business activity continues to grow, supported by AI-related investment and steady consumer spending. While geopolitical risks, elevated services inflation, and lingering producer-price pressures warrant caution, the overall picture is one of continued expansion with gradually cooling inflation: conditions that should keep the Federal Reserve on hold as it awaits further evidence that price stability is being restored.
Early corporate earnings reports reinforce that cautiously optimistic outlook. An alternative, real-time gauge of economic activity generated by Bloomberg and based on whether S&P 500 companies exceed sales expectations has produced one of its strongest early readings since 2015. Twenty-nine of the first thirty-one reporting firms surpassed revenue forecasts through July 22. Because firm revenue growth provides a cleaner measure of underlying demand than earnings (which can be boosted by cost-cutting or financial engineering) the unusually broad strength in sales suggests second-quarter GDP may ultimately exceed current consensus forecasts by roughly a quarter of a percentage point. The sample remains small and should be interpreted cautiously, but the early earnings season adds to a growing body of evidence that consumer demand, business investment, and overall economic activity were firmer in the second quarter than many economists had anticipated, which in turn reinforces the case for continued economic expansion alongside a Federal Reserve that remains comfortably on hold.
LEADING INDICATORS
ROUGHLY COINCIDENT INDICATORS
LAGGING INDICATORS
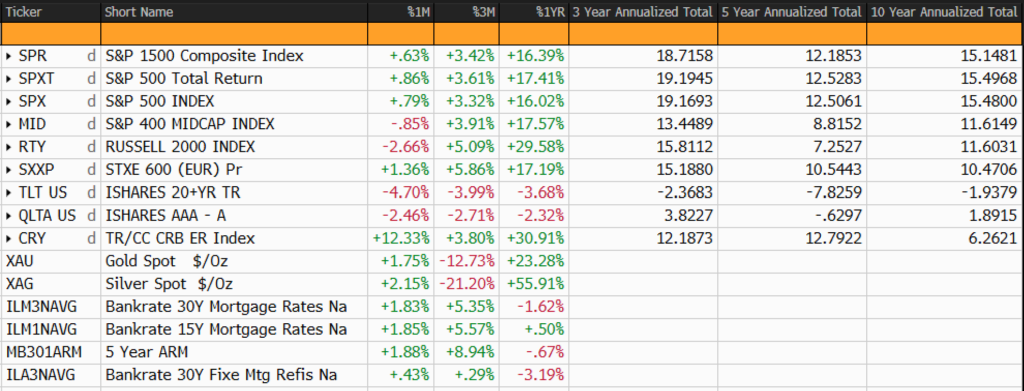
CAPITAL MARKETS PERFORMANCE