Here’s a quick recap of the crypto landscape for March 9 as of 9:00 a.m. UTC.
Get the latest insights on Bitcoin, Ether and altcoins, along with a round-up of key cryptocurrency market news.
Bitcoin (BTC) was priced at US$67,799.36, up by 0.6 percent over the last 24 hours.
Bitcoin price performance, March 9, 2026.
Chart via TradingView
Ether (ETH) was priced at US$1,996.40, up by 2.2 percent over the last 24 hours.
Altcoin price update
XRP (XRP) was priced at US$1.35, down by 0.3 percent over 24 hours.
Solana (SOL) was trading at US$83.67, up by 1.2 percent over 24 hours.
Today’s crypto news to know
Bitcoin slips as oil shock rattles global markets
Bitcoin traded under pressure over the weekend as a surge in oil prices and escalating tensions in the Middle East unsettled global markets.
The world’s largest cryptocurrency hovered near US$66,456, down roughly 1.7 percent over 24 hours, after briefly dipping below US$66,000. US stock futures also dropped sharply ahead of the new trading week, with Dow futures falling more than 800 points and contracts tied to the S&P 500 and Nasdaq also sliding.
Energy markets drove much of the turbulence. West Texas Intermediate (WTI) crude jumped about 18 percent to above $107 per barrel, while Brent crude surged roughly 16 percent, pushing global oil benchmarks back above the US$100 mark for the first time since 2022.
Traders are increasingly worried about potential supply disruptions through the Strait of Hormuz, a narrow shipping corridor responsible for roughly one-fifth of global oil shipments. Israeli airstrikes targeting energy infrastructure in Tehran and Iranian drone attacks against oil-related assets across the Gulf have intensified fears that the conflict could spread into global energy markets.
Treasury pushes legal authority to freeze suspicious crypto funds
The US Treasury Department is urging lawmakers to create a new legal framework allowing crypto platforms to temporarily freeze funds tied to suspected criminal activity.
The proposal appears in a report submitted to Congress under the GENIUS Act, the legislation that established the first federal framework for stablecoins.
Under the recommendation, exchanges and financial institutions would receive a legal “safe harbor” enabling them to hold suspicious digital assets while investigators review potential illicit activity. Today, crypto firms often identify questionable transfers through blockchain analytics but lack clear authority to pause those assets without risking legal exposure.
The proposed hold law would create a defined window during which platforms could delay suspicious transactions before funds are moved through additional wallets or converted to other assets.
US judge dismisses terrorism lawsuit against Binance
A federal judge has dismissed a lawsuit accusing Binance of facilitating terrorism financing, dealing a legal victory to the world’s largest cryptocurrency exchange.
The case was brought by more than 500 plaintiffs who were victims of, or related to victims of, attacks carried out by militant groups including Hamas, Hezbollah, and ISIS between 2016 and 2024. The plaintiffs argued that Binance knowingly allowed transactions linked to sanctioned entities, indirectly enabling funds to reach terrorist organizations.
However, US District Judge Jeannette Vargas ruled that the complaint failed to establish a direct connection between the exchange’s conduct and specific attacks cited in the case. Awareness of potential misuse alone, the court said, does not meet the legal threshold required under the Justice Against Sponsors of Terrorism Act.
While the judge dismissed the case, she gave plaintiffs 60 days to amend their filing with more specific evidence tying individual transactions and wallet addresses to particular attacks.
Binance welcomed the decision, calling it a “complete vindication” of what it described as unfounded allegations.
Securities Disclosure: I, Meagen Seatter, hold no direct investment interest in any company mentioned in this article.
Securities Disclosure: I, Giann Liguid, hold no direct investment interest in any company mentioned in this article.
CALGARY, AB / ACCESS Newswire / March 9, 2026 / Valeura Energy Inc. (TSX:VLE,OTC:VLERF)(OTCQX:VLERF) (‘Valeura’ or the ‘Company’) acknowledges decrees pertaining to Thailand’s new fuel security measures, as signed by Thailand’s Prime Minister and published in the Royal Thai Government Gazette on 06 March 2026 (the ‘decrees’).
The decrees restrict immediately, exports of four major refined fuel categories, being gasoline/gasohol, diesel, jet A1 fuel, and liquified petroleum gas. The decrees do not impose restrictions on exporting crude oil.
Valeura intends to continue supporting Thailand’s energy security by providing a reliable stream of domestically-produced oil.
The Company continues to expect that its crude oil sales will continue to attain prevailing market pricing, with price realisations approximately equivalent to the Brent crude oil benchmark.
For further information, please contact:
Valeura Energy Inc. (General Corporate Enquiries) Sean Guest, President and CEO Yacine Ben-Meriem, CFO Contact@valeuraenergy.com
+65 6373 6940
Valeura Energy Inc. (Investor and Media Enquiries) Robin James Martin, Vice President, Communications and Investor Relations IR@valeuraenergy.com
+1 403 975 6752 / +44 7392 940495
Contact details for the Company’s advisors, covering research analysts and joint brokers, including Auctus Advisors LLP, Beacon Securities Limited, Canaccord Genuity Ltd (UK), Cormark Securities Inc., Research Capital Corporation, Roth Canada Inc., and Stifel Nicolaus Europe Limited, are listed on the Company’s website at www.valeuraenergy.com/investor-information/analysts/.
About the Company
Valeura Energy Inc. is a Canadian public company engaged in the exploration, development and production of petroleum and natural gas in Thailand and in Türkiye. The Company is pursuing a growth-oriented strategy and intends to re-invest into its producing asset portfolio and to deploy resources toward further organic and inorganic growth in Southeast Asia. Valeura aspires toward value accretive growth for stakeholders while adhering to high standards of environmental, social and governance responsibility.
Additional information relating to Valeura is also available on SEDAR+ at http://www.sedarplus.ca.
Advisory and Caution Regarding Forward-Looking Information
Certain information included in this news release constitutes forward-looking information under applicable securities legislation. Such forward-looking information is for the purpose of explaining management’s current expectations and plans relating to the future. Readers are cautioned that reliance on such information may not be appropriate for other purposes, such as making investment decisions. Forward-looking information typically contains statements with words such as ‘anticipate’, ‘believe’, ‘expect’, ‘plan’, ‘intend’, ‘estimate’, ‘propose’, ‘project’, ‘target’ or similar words suggesting future outcomes or statements regarding an outlook. Forward-looking information in this news release includes, but is not limited to, the Company’s intent to continue providing a reliable stream of domestically-produced oil; and the Company’s expectation that its crude oil sales will continue to attain prevailing market pricing, with price realisations approximately equivalent to the Brent crude oil benchmark.
Forward-looking information is based on management’s current expectations and assumptions regarding, among other things: political stability of the areas in which the Company is operating; continued safety of operations and ability to proceed in a timely manner; continued operations of and approvals forthcoming from governments and regulators in a manner consistent with past conduct; future drilling activity on the required/expected timelines; the prospectivity of the Company’s lands; the continued favourable pricing and operating netbacks across its business; future production rates and associated operating netbacks and cash flow; decline rates; future sources of funding; future economic conditions; the impact of inflation of future costs; future currency exchange rates; interest rates; the ability to meet drilling deadlines and fulfil commitments under licences and leases; future commodity prices; the impact of the Russian invasion of Ukraine; royalty rates and taxes; future capital and other expenditures; the success obtained in drilling new wells and working over existing wellbores; the performance of wells and facilities; the availability of the required capital to funds its exploration, development and other operations, and the ability of the Company to meet its commitments and financial obligations; the ability of the Company to secure adequate processing, transportation, fractionation and storage capacity on acceptable terms; the capacity and reliability of facilities; the application of regulatory requirements respecting abandonment and reclamation; the recoverability of the Company’s reserves and contingent resources; future growth; the sufficiency of budgeted capital expenditures in carrying out planned activities; the impact of increasing competition; the ability to efficiently integrate assets and employees acquired through acquisitions; global energy policies going forward; future debt levels; and the Company’s continued ability to obtain and retain qualified staff and equipment in a timely and cost efficient manner. In addition, the Company’s work programmes and budgets are in part based upon expected agreement among joint venture partners and associated exploration, development and marketing plans and anticipated costs and sales prices, which are subject to change based on, among other things, the actual results of drilling and related activity, availability of drilling, offshore storage and offloading facilities and other specialised oilfield equipment and service providers, changes in partners’ plans and unexpected delays and changes in market conditions. Although the Company believes the expectations and assumptions reflected in such forward-looking information are reasonable, they may prove to be incorrect.
Forward-looking information involves significant known and unknown risks and uncertainties. Exploration, appraisal, and development of oil and natural gas reserves and resources are speculative activities and involve a degree of risk. A number of factors could cause actual results to differ materially from those anticipated by the Company including, but not limited to: the ability of management to execute its business plan or realise anticipated benefits from acquisitions; the risk of disruptions from public health emergencies and/or pandemics; competition for specialised equipment and human resources; the Company’s ability to manage growth; the Company’s ability to manage the costs related to inflation; disruption in supply chains; the risk of currency fluctuations; changes in interest rates, oil and gas prices and netbacks; potential changes in joint venture partner strategies and participation in work programmes; uncertainty regarding the contemplated timelines and costs for work programme execution; the risks of disruption to operations and access to worksites; potential changes in laws and regulations, the uncertainty regarding government and other approvals; counterparty risk; the risk that financing may not be available; risks associated with weather delays and natural disasters; and the risk associated with international activity. See the most recent annual information form and management’s discussion and analysis of the Company for a detailed discussion of the risk factors.
The forward-looking information contained in this new release is made as of the date hereof and the Company undertakes no obligation to update publicly or revise any forward-looking information, whether as a result of new information, future events or otherwise, unless required by applicable securities laws. The forward-looking information contained in this new release is expressly qualified by this cautionary statement.
This news release does not constitute an offer to sell or the solicitation of an offer to buy securities in any jurisdiction, including where such offer would be unlawful. This news release is not for distribution or release, directly or indirectly, in or into the United States, Ireland, the Republic of South Africa or Japan or any other jurisdiction in which its publication or distribution would be unlawful.
Neither the Toronto Stock Exchange nor its Regulation Services Provider (as that term is defined in the policies of the Toronto Stock Exchange) accepts responsibility for the adequacy or accuracy of this news release.
This information is provided by Reach, the non-regulatory press release distribution service of RNS, part of the London Stock Exchange. Terms and conditions relating to the use and distribution of this information may apply. For further information, please contact rns@lseg.com or visit www.rns.com.
SOURCE: Valeura Energy Inc.
View the original press release on ACCESS Newswire
If you only followed the political feed, you would think the world is splitting into billionaires on yachts and everyone else eating instant noodles forever. Then you see the data, and the narrative gets awkward, fast.
A recent Economist graphic, in the article “The world is more equal than you think”, underscores something many people do not want to say out loud: global living standards have been converging, meaning poorer countries have been catching up in ways that matter for real life.
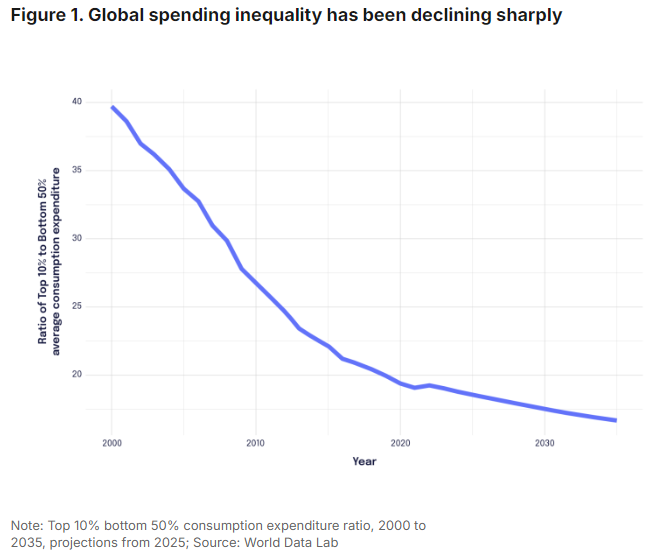
And the newest Brookings analysis adds detail to that picture, showing that global inequality has declined this century in consumption-based measures and linking the improvement to faster growth in places like China and India, as well as broader gains across parts of Southeast Asia and Eastern Europe.
That is not a victory lap. It is a reality check.
The inequality debate matters because it shapes policy. When lawmakers believe the world is growing less fair by the day, they reach for bigger government as the default response. But if the real goal is upward mobility, opportunity, and a decent life for regular people, the biggest obstacle is not “the rich.” It is the policy machinery that blocks competition, inflates costs, and quietly transfers wealth toward the politically connected.
What The Global Story Actually Says
Researchers at Brookings point to two forces behind global inequality trends: the “between-country” gap (the difference in average living standards across countries) and the “within-country” gap (inequality within each country). They find that the between-country side has been an equalizing force because many developing countries have grown faster than advanced economies. They note that in 2000, cross-country income differences accounted for about 70 percent of global inequality, with that share falling as countries converge. They also highlight that the within-country component has been mixed but roughly constant on average since 2000, and is projected to become more important going forward. The share of global consumption for the world’s poorest half rose from about 7 percent in 2000 to 12 percent in 2025. That is still low, but it is movement in the right direction. (If you are scoring at home, “the poor getting more” is not supposed to happen in the apocalyptic version of this story.)
Now layer in a second data stream that is even easier to understand: are the poor in a given country seeing their incomes rise?
The Our World in Data chart tracks the annualized growth rate of real income or consumption for the bottom 40 percent of a country’s population, based on household surveys and the World Bank’s Poverty and Inequality Platform. It is not perfect, but it is grounded in the question people actually care about: are those nearer the bottom moving up?
This is what a healthy “inequality conversation” should sound like: less sermonizing about billionaires, more focus on whether people are gaining purchasing power and options.
The Alternative View Deserves a Hearing, Then a Cross-Examination
Oxfam’s 2026 report, “Resisting the Rule of the Rich”, argues that billionaire wealth is rising rapidly and that extreme wealth can undermine democracy. It claims billionaire fortunes have grown at a rate “three times faster” than the previous five years and that the number of billionaires has surpassed 3,000, while “one in four” people face hunger.
That is the kind of framing that fuels the “eat the rich” mood. But here is the problem: it often treats “wealth” as if it were a pile of cash stolen from everyone else, rather than a constantly changing market valuation of businesses that create products, jobs, and productivity. It also slides between important concerns (cronyism and corruption) and a very different claim (free enterprise itself is the culprit). That bait-and-switch is common.
If the real concern is political capture, that concern is understandable. The solution, however, is not to hand more power to the same institutions that create capture in the first place. The way to weaken oligarchy is to eliminate the deals, carve-outs, and barriers to entry that make oligarchy profitable.
And yes, big tech and “superstar” companies raise real governance questions. Even The Economist has highlighted the “superstar dilemma” in corporate pay and talent markets, a complex issue that is not always pretty. But the cleanest way to discipline superstar firms is not to freeze the economy into a regulator’s version of fairness. It is to keep markets contestable, meaning new entrants can actually challenge incumbents.
The Uncomfortable US Lesson: Growth Beats Dependency
Here is where the inequality myth really breaks down. If the concern is that markets cannot deliver broad progress, then we should look at periods when broad progress actually happened.
A new NBER working paper by Richard Burkhauser and Kevin Corinth provides a blunt historical comparison of poverty trends before and after the War on Poverty. They build a consistent post-tax, post-transfer measure and find that from 1939 to 1963, poverty fell by 29 percentage points, and that the pace of poverty reduction after 1963 was no faster when measured consistently. They also emphasize that the pre-1964 reduction in poverty was driven mostly by market income growth, not by expansions in transfers.
That is not a claim that safety net programs have no value. It is a reminder that the most powerful anti-poverty program is still called a job in a growing economy, supported by rising productivity and competition.
When politics replaces growth with managed redistribution, it can reduce measured poverty in a narrow accounting sense while trapping people in low-mobility systems and higher cost structures.
So what is the real driver of inequality, perceived or real? Policy.
If people feel the game is rigged, it is usually because it is, but not in the simplistic “the rich did it” way. It is rigged through four main channels.
Spending Government spending is not “new money.” It is a transfer of scarce resources from private activity into political allocation. Once spending becomes the main tool for solving every social problem, the economy becomes a contest for subsidies, grants, and contracts. That is how you get corporate welfare and permanent bureaucracies that grow regardless of results. The cost is what you do not see: businesses not started, wages not earned, inventions not funded.
Taxation Tax systems loaded with carveouts reward the people who can hire the best experts to navigate them. High rates plus Swiss-cheese loopholes do not produce equality. They produce lobbying. If lawmakers want more fairness, the answer is simpler and more neutral taxation that stops picking winners and losers.
Regulation This is the quiet cartel-maker. Complex rules do not crush giant firms first. They crush the next competitor. Licensing, zoning restrictions, compliance mandates, and paperwork costs operate like a moat around incumbents. That means less competition, higher prices, and fewer ladders for people trying to move up.
Monetary policy Central bank discretion can amplify inequality by inflating asset prices and distorting capital allocation. When money is too loose for too long, assets can surge while wages lag, and the gap between owners and non-owners widens. You do not need a conspiracy theory. You just need incentives and a printing press.
Put these together, and you get a simple but unpopular conclusion: if inequality is your headline concern, you should be far more skeptical of the modern policy state.
A Classical Liberal Approach That Actually Helps People Move Up
The goal is not equality of outcome. That is a slogan that turns into control. The goal is mobility, meaning the ability to improve your life through work, saving, entrepreneurship, and choice.
That requires a strict limit on government spending growth so the state stops sucking the economy’s oxygen. A simpler tax system that lowers the penalty on work, saving, and investment. Deregulation that targets barriers to entry, especially in sectors where families feel crushed. Clear fiscal and monetary rules that stop politicians from buying today with tomorrow’s prosperity.
If someone still insists that “inequality proves capitalism failed,” point them to the global convergence evidence in Brookings and the mobility-focused reality behind the Our World in Data bottom-40 growth rates. Then ask the question that separates economics from activism: if government expanded massively and the best eras of poverty reduction were still powered by growth, why are we so confident that more government is the answer?
The punchline is not “stop caring.” The punchline is “stop being fooled.” If you want a world where more people can thrive, the most reliable path is still the boring one: freer markets, real competition, and hard rules that prevent government from rigging the economy while claiming it is saving it.
I’ve taught Principles of Microeconomics (“ECON 101”) regularly now for nearly a half-century. The first such course I taught was in the Fall Quarter of 1982 at Auburn University, my first year of graduate school there (after having received an M.A. in economics earlier that year from NYU). And except for a few years in the 1990s, I’ve taught ECON 101 every semester since, including in many summers. The total number of “micro principles” students whom I’ve taught over these years is likely in the neighborhood of 12,000. Mostly, I teach this course in auditoriums that hold between 200 and 350 students.
I never tire – and I’m sure that I never will tire – of walking into a classroom to introduce mostly 18-year-olds to the economic way of thinking. It’s still great fun and immensely rewarding, for I do regularly see the proverbial light bulbs being lit over many students’ heads.
My ECON 101 course is taught as if it’s the only economic course my students will ever take. Unlike many professors, I do not teach Principles of Microeconomics to prepare my students for Intermediate Microeconomics, which is the next course up in the curriculum. Some such preparation occurs, I’m pleased to report, but that’s all incidental. My chief goal is to inject my students with the rudiments of the economic way of thinking in order to inoculate them against the most virulent fallacies that are likely to try to infect their minds as they go through life.
What does that inoculation look like in practice? It begins with lessons such as these:
Those of us alive in the modern, industrial world are among the materially richest human beings who ever lived, by far.
There’s no such thing as a free lunch.
In economic matters, there are no solutions, only trade-offs.
Prices and wages set on markets are not arbitrary; market prices and wages reflect underlying economic realities as they also guide buyers, sellers, employers, and workers to better coordinate their plans and actions with each other.
Profits in markets are not ‘extracted’ from workers or consumers; profits are the rewards for creatively using resources in ways to better satisfy consumer desires.
Trade across political borders differs in no relevant economic respects from trade that occurs within political borders.
Collective or political decision-making is done by the same imperfect and self-interested human beings who decide and act in private markets.
The above list is only a sample; it doesn’t exhaust the topics that I cover in the course. But were I to make an exhaustive list of those topics, some of what most other ECON 101 teachers teach would not be found on my list. I long ago stopped drawing cost curves and teaching the theories of so-called “perfect competition” and “monopolistic competition.” Whatever insights into the real-world economy and market processes are offered by these theories, if they exist at all, are too meager to justify the time required to ‘teach’ them. I instead spend far more time than is conventional teaching both basic public-choice economics and international trade.
No student passes my course without learning that real-world market processes must be compared to real-world political processes rather than to ideal political processes. Likewise, every student who passes my ECON 101 course learns that protectionism neither increases nor decreases domestic employment, and that trade deficits are balanced out by capital inflows.
I’m pleased to report that I have almost never encountered a student who expressed hostility to the economic way of thinking. I’m even more pleased to report that from time to time, students tell me that, because of my course, they’ve switched their major to economics. A handful of these students even went on to earn PhDs in economics.
Perhaps the single most noticeable change in students since I began teaching is that increasing numbers of them are confused about how to take notes. My teaching style, I gather, is old-fashioned. I lecture. I write on the (now white) board, while occasionally showing PowerPoint presentations. As I lecture, I tell what the late, great economics professor Paul Heyne called “plausible stories” about how the economy works. I do my very best to avoid jargon.
More and more, students come up to me after class saying that they “don’t know how to take notes” in my class. Frankly, I’m befuddled. I remind them that they are free to tape my lectures. Beyond that, I suggest that they pay close attention to what I say and write on the board during lectures. The students should determine for themselves what the essential points are, and then record those points in their notebooks. Students, of course, are also invited to visit me during office hours. Some students do; most do not.
Good students who attend class regularly have no problem earning an A in my course. My course is intentionally not difficult, not least because the material in ECON 101 isn’t naturally difficult. While some parts of the course are a bit more challenging than others – mastering comparative advantage requires somewhat more brain application than mastering the law of demand – none of ECON 101 is, or should be made to be, difficult. I want my students to enjoy economics because, well, economics is inherently interesting.
I’m dismayed by the number of people whom I’ve met over the years who, upon learning what I do for a living, volunteer to me just how much they disliked the “boring” or “dull” or “pointless” economics course or courses they took in college. Those individuals suffered the misfortune of having had bad economics teachers. I pity them.
The most disturbing change that I’ve encountered in teaching is one that arose only in the past ten or twelve years. It’s the number of students who are granted by the university the special privilege of being able to take exams away from their classmates and with extra time. Up to a dozen students each semester now give me documents that prove that I’m required by the university to let them take exams while alone in a room and with more time than most students are allotted to take exams.
I accommodate these students as required. I like my job too much to risk losing it by refusing to go along with this trend. But I confess that I feel sorry for each and every one of these students who assert their need for “special accommodations.” When they graduate and go out into the job market, the accommodations that they enjoyed in college will generally not be available from their employers. These students will have a more difficult time than the typical new college graduate adjusting to life in the real world.
I do not think poorly of these students nor hold their ‘need’ for special accommodation against them. The ones who earn high grades are assigned the high grades that they earn. But I nevertheless worry about their life prospects.
Now that I’m in my mid-60s, I’m often asked when I will retire. “Retire?” I always reply. “From what? I love teaching today no less than I did 40 years ago. I will teach, if I’m physically able, for as long as I remain in love with, and excited by, the principles of economics – which will be until my dying day.”
Last month, Congress sparred with the president over a partial budget, but with few real cuts, America’s slow march toward an epic debt crisis went on undeterred. With over $38 trillion in debt and interest payments exceeding defense or Medicare spending, one would expect lawmakers to confront reality and do the difficult work needed to restore fiscal sanity. But why would they? Cutting entitlements and increasing middle-class taxes rarely make for winning campaign slogans.
It’s no surprise, then, that some prefer to pin their hopes on AI as America’s fiscal savior. Vanguard’s chief economist Joe Davis argued there’s as high as a 50 percent chance AI will prevent a debt-driven economic malaise. Elon Musk voiced a similar conclusion late last year, claiming AI and robotics are “the only thing that’s going to solve the US debt crisis.”
The argument goes like this: an AI boom drives explosive economic growth and tax revenue, while, at the same time, productivity gains impressively offset any upward pressure on interest rates. The deficit becomes a surplus and the overall debt shrinks, possibly disappearing entirely.
If that sounds less like a policy plan and more like a retirement strategy built around winning the lottery, you’re not wrong. The entire scenario hinges on a massive if: that AI generates extraordinary revenue and does it quickly enough to outrun rising interest costs.
But even if the government hits the tax revenue jackpot before Congress drives us off a fiscal cliff, it would be naïve to assume lawmakers would pay down the debt.
The More the Government Gets, the More the Government Spends
For the sake of argument, suppose the tech optimists are right, and the federal government enjoys a massive AI-driven revenue windfall. Understanding what happens next requires understanding the incentives of politicians and their voters.
This is where public choice shines. Rather than assuming politicians and voters act in everyone’s best interest, this branch of economics recognizes that people don’t become angels once they interface with the government. Incentives matter, especially for politicians.
Incentives are why we have a deficit in the first place. The public isn’t particularly interested in financial restraint because high spending and low taxes benefit them now, and the resulting debt is some future generation’s problem. Politicians surely see the crisis brewing, but solving it is a sure way to get voted out of office. And so the incentive is to run constant deficits and grow the debt year after year, decade after decade.
Without changing incentives, it will be hard to avoid spending new revenue. Ballooning coffers mean voters will demand that the government dole out more goodies (especially if AI displaces workers along the way). Washington already excels at entertaining expensive ideas: healthcare subsidies for well-off families, a universal basic income, generous tax cuts, a fifty-percent increase in military spending, all despite the pushback the current deficit’s able to muster. Imagine the wish list after it drops even a little.
Expecting Congress to use a jolt of revenue to pay down debt is like expecting a compulsive gambler to save his winnings for retirement. There’s a reason nearly a third of lottery winners file for bankruptcy within five years of getting their windfall. Winners tend to be the ones who bought a lot of tickets, and people who buy a lot of tickets tend to be reckless with their money.
Not all lottery winners are reckless, and not all lawmakers are more interested in buying votes than paying off debts. The question is whether Congress is more likely to emulate the prudent winner or the reckless one.
This Has All Happened Before…
Public choice theory suggests we already know the answer, but maybe there’s some crucial detail we’re missing. Or maybe American politics is just different in some way. The good (or, depending on your position, bad) news is that we have a ready example from the last time a tech revolution balanced the government budget: the internet boom of the late 1990s.
Right before investors realized you couldn’t slap a ‘dot-com’ onto any English word and make a billion dollars selling pet food over what we laughingly called the information superhighway, a surge of investment handed the Treasury Department the biggest budget surplus since World War II demilitarization. It also arrived in time for a presidential election.
The 2000 election pitted Vice President Al Gore against Texas Governor George W. Bush, and the question of what to do with the surplus was a major campaign issue. Gore proposed using some of it to pay down the debt. Bush preferred spending it on tax cuts, Social Security, and “important projects.” Yes, the Democrat was more of a fiscal conservative than the Republican. Those were wild times.
Bush would go on to win that election.
It was incredibly close, and Gore could’ve easily won. And if not for something called a butterfly ballot, he would’ve won.
But he didn’t win, and all we knew at the time was that it was very, very close. It was so close that if Gore had promised some “important projects” in Florida instead of paying down a bill that wouldn’t have come due until some distant decade, the White House would’ve been his.
Losing by a hair’s breadth is every campaign’s nightmare. Mere oversights become colossal blunders, and every ill-fated gamble becomes a decisive mistake. The 2000 election made something crystal clear to anyone who hadn’t already gotten the memo: prudence is for losers.
The surplus proved to be transient anyway, vaporized in the aftermath of 9/11 and the bursting of the dot-com bubble. The US returned to familiar deficit territory two years later, and we never looked back.
…And It Will Happen Again.
The optimists might say that this time will be different. The looming deficit crisis is so bad that politicians will use any AI windfall to pay down the debt rather than spend it. This time they’ll do the responsible thing.
Be serious.
It’s of course possible that the political stars align and lawmakers will pay down the deficit instead of playing another round of “someone else’s problem.” It’s possible that the prudent thing will be done without a financial crisis to jar the public out of their “the future is never” fantasy.
But let’s get real. Though public concern about the debt is high, there’s so much disagreement about how to address the problem that politicians can safely ignore it. When President Trump threw his own eye-watering increase onto the debt last year, his approval rating didn’t budge. Voters say they care about the debt but they clearly care more about the things that have created it. The political incentives are the same as they ever were: if the government wins the AI lottery, lawmakers will behave as they always have. This time won’t be different.
CALGARY, AB / ACCESS Newswire / March 9, 2026 / Valeura Energy Inc. (TSX:VLE,OTC:VLERF)(OTCQX:VLERF) (‘Valeura’ or the ‘Company’) announces completion of a successful infill drilling campaign at its Gulf of Thailand Manora field (Block G1/48, 70% operated working interest).
Dr. Sean Guest, President and CEO commented: ‘Our Manora drilling campaign illustrates that we can continue adding to the ultimate production potential of our Gulf of Thailand fields. Our approach is to take every opportunity to appraise potential future development locations while developing known reservoir intervals. We have once again delivered new production from the field and also laid the basis for further development in the future.’
Valeura successfully drilled a campaign comprised of two infill development targets and one appraisal well from the Manora A platform. All wells were successful, and notably the appraisal well was found to be optimally positioned for use as a production well. As a result, all three wells have been completed as oil producers and are now on stream. Manora’s oil production has increased from an average of 1,950 bbls/d prior to the first new well coming onstream, to a more recent average of 2,626 bbls/d (working interest share oil production before royalites)(1).
Valeura’s management expects that the newly encountered reservoir intervals will be considered in the next evaluation of reserves and could therefore be additive to the ultimate potential and economic life of the asset.
MNA-41 was drilled as a deviated appraisal well to evaluate the potential of two reservoir intervals. The well encountered oil pay in the 300-series sand reservoir, which will be analysed to identify future prospects in this zone. In addition, the well encountered five oil pay zones in the 400/500-series reservoir. It has been completed as a comingled oil producer and is now on production. Results have exceeded management’s expectations, which sought only to assess the potential for future development of these intervals.
MNA-35ST1 was drilled as a sidetrack to the pre-exisitng MNA-35 well, with the objective of developing the same two reservoir intervals access in MNA-41. Two pay zones were encountered in the 300 sands, which will be completed for production in the future. In the meantime, the well has been completed as a producer of five oil pay zones within the 400/500 reservoir sands and is now on production.
MNA-42H was geo-steered as a horizontal development well within the 300 series sand reservoir. The well’s 1,046 ft lateral section encountered 556′ of net oil pay, which has exceeded management’s expectations. The well has been completed and is now online as a horizontal oil producer.
The Manora drilling campaign was completed safely, on time, and on budget. Valeura’s contracted drilling rig has now been mobilised to the Nong Yao field on block G11/48 (90% operated working interest) where the Company is planning to drill a production-oriented campaign from the Nong Yao A and Nong Yao B wellhead facilities.
(1) 15-24 February 2026 vs 03-12 February 2026.
Future Disclosure Valeura intends to release its audited financial results for the year ended 31 December 2025, along with its annual information form for 2025 and its estimates of reserves and resources in accordance with the requirements of National instrument 51-101 – Standards of Disclosure for Oil and Gas Activities on 18 March 2026.
For further information, please contact:
Valeura Energy Inc. (General Corporate Enquiries) Sean Guest, President and CEO Yacine Ben-Meriem, CFO Contact@valeuraenergy.com
+65 6373 6940
Valeura Energy Inc. (Investor and Media Enquiries) Robin James Martin, Vice President, Communications and Investor Relations IR@valeuraenergy.com
+1 403 975 6752 / +44 7392 940495
Contact details for the Company’s advisors, covering research analysts and joint brokers, including Auctus Advisors LLP, Beacon Securities Limited, Canaccord Genuity Ltd (UK), Cormark Securities Inc., Research Capital Corporation, Roth Canada Inc., and Stifel Nicolaus Europe Limited, are listed on the Company’s website at www.valeuraenergy.com/investor-information/analysts/.
About the Company
Valeura Energy Inc. is a Canadian public company engaged in the exploration, development and production of petroleum and natural gas in Thailand and in Türkiye. The Company is pursuing a growth-oriented strategy and intends to re-invest into its producing asset portfolio and to deploy resources toward further organic and inorganic growth in Southeast Asia. Valeura aspires toward value accretive growth for stakeholders while adhering to high standards of environmental, social and governance responsibility.
Additional information relating to Valeura is also available on SEDAR+ at http://www.sedarplus.ca.
Advisory and Caution Regarding Forward-Looking Information
Certain information included in this news release constitutes forward-looking information under applicable securities legislation. Such forward-looking information is for the purpose of explaining management’s current expectations and plans relating to the future. Readers are cautioned that reliance on such information may not be appropriate for other purposes, such as making investment decisions. Forward-looking information typically contains statements with words such as ‘anticipate’, ‘believe’, ‘expect’, ‘plan’, ‘intend’, ‘estimate’, ‘propose’, ‘project’, ‘target’ or similar words suggesting future outcomes or statements regarding an outlook.
Forward-looking information in this news release includes, but is not limited to, the Manora drilling results laying the basis for further development work in the future; and management’s expectation that the newly encountered reservoir intervals will be considered in the next evaluation of reserves and could therefore be additive to the ultimate potential and economic life of the asset.
Forward-looking information is based on management’s current expectations and assumptions regarding, among other things: political stability of the areas in which the Company is operating; continued safety of operations and ability to proceed in a timely manner; continued operations of and approvals forthcoming from governments and regulators in a manner consistent with past conduct; future drilling activity on the required/expected timelines; the prospectivity of the Company’s lands; the continued favourable pricing and operating netbacks across its business; future production rates and associated operating netbacks and cash flow; decline rates; future sources of funding; future economic conditions; the impact of inflation of future costs; future currency exchange rates; interest rates; the ability to meet drilling deadlines and fulfil commitments under licences and leases; future commodity prices; the impact of the Russian invasion of Ukraine; royalty rates and taxes; future capital and other expenditures; the success obtained in drilling new wells and working over existing wellbores; the performance of wells and facilities; the availability of the required capital to funds its exploration, development and other operations, and the ability of the Company to meet its commitments and financial obligations; the ability of the Company to secure adequate processing, transportation, fractionation and storage capacity on acceptable terms; the capacity and reliability of facilities; the application of regulatory requirements respecting abandonment and reclamation; the recoverability of the Company’s reserves and contingent resources; future growth; the sufficiency of budgeted capital expenditures in carrying out planned activities; the impact of increasing competition; the ability to efficiently integrate assets and employees acquired through acquisitions; global energy policies going forward; future debt levels; and the Company’s continued ability to obtain and retain qualified staff and equipment in a timely and cost efficient manner. In addition, the Company’s work programmes and budgets are in part based upon expected agreement among joint venture partners and associated exploration, development and marketing plans and anticipated costs and sales prices, which are subject to change based on, among other things, the actual results of drilling and related activity, availability of drilling, offshore storage and offloading facilities and other specialised oilfield equipment and service providers, changes in partners’ plans and unexpected delays and changes in market conditions. Although the Company believes the expectations and assumptions reflected in such forward-looking information are reasonable, they may prove to be incorrect.
Forward-looking information involves significant known and unknown risks and uncertainties. Exploration, appraisal, and development of oil and natural gas reserves and resources are speculative activities and involve a degree of risk. A number of factors could cause actual results to differ materially from those anticipated by the Company including, but not limited to: the ability of management to execute its business plan or realise anticipated benefits from acquisitions; the risk of disruptions from public health emergencies and/or pandemics; competition for specialised equipment and human resources; the Company’s ability to manage growth; the Company’s ability to manage the costs related to inflation; disruption in supply chains; the risk of currency fluctuations; changes in interest rates, oil and gas prices and netbacks; potential changes in joint venture partner strategies and participation in work programmes; uncertainty regarding the contemplated timelines and costs for work programme execution; the risks of disruption to operations and access to worksites; potential changes in laws and regulations, the uncertainty regarding government and other approvals; counterparty risk; the risk that financing may not be available; risks associated with weather delays and natural disasters; and the risk associated with international activity. See the most recent annual information form and management’s discussion and analysis of the Company for a detailed discussion of the risk factors.
The forward-looking information contained in this new release is made as of the date hereof and the Company undertakes no obligation to update publicly or revise any forward-looking information, whether as a result of new information, future events or otherwise, unless required by applicable securities laws. The forward-looking information contained in this new release is expressly qualified by this cautionary statement.
This news release does not constitute an offer to sell or the solicitation of an offer to buy securities in any jurisdiction, including where such offer would be unlawful. This news release is not for distribution or release, directly or indirectly, in or into the United States, Ireland, the Republic of South Africa or Japan or any other jurisdiction in which its publication or distribution would be unlawful.
Neither the Toronto Stock Exchange nor its Regulation Services Provider (as that term is defined in the policies of the Toronto Stock Exchange) accepts responsibility for the adequacy or accuracy of this news release.
This information is provided by Reach, the non-regulatory press release distribution service of RNS, part of the London Stock Exchange. Terms and conditions relating to the use and distribution of this information may apply. For further information, please contact rns@lseg.com or visit www.rns.com.
SOURCE: Valeura Energy Inc.
View the original press release on ACCESS Newswire
MCLEAN, Va. – As Americans are stranded in the Middle East amid the U.S. and Israel war with Iran, government and private agencies are working around the clock to conduct evacuations.
In addition to the U.S. Department of State’s 24/7 task force aimed at evacuating Americans, private security firm Global Guardian is also working around the clock to complete the same mission.
As of Friday, Global Guardian has evacuated more than 4,000 people from the Middle East, according to its CEO and President, Dale Robert Buckner.
While operations and logistics teams sit in an office building in northern Virginia, the firm has personnel in more than 140 countries, allowing Global Guardian access to nearly every corner of the world for emergency response or evacuations.
‘We provide medical evac services, we provide kidnap, ransom, extortion negotiation payment if someone is kidnapped or extorted,’ Buckner said. ‘We’re providing about 300 missions a month of executive protection travel, in about 84 countries a month.’
The private security firm also conducts camera surveillance of residences and commercial property and has cyber analysts monitoring mobile devices.
After the U.S. and Israel struck Iran in a joint attack last weekend, the firm has been coordinating multiple emergency response evacuations — but this isn’t the first time it has assisted Americans out of a crisis zone.
‘That means getting people out of Puerto Vallarta a week ago, and Jalisco, Mexico. That means getting people out of Asheville, North Carolina when it got wiped out by a hurricane,’ Buckner said.
Logistically, getting tourists out of a war zone and back to safety is a process, but the firm works fast, completing their first border crossing within the first six hours of the missile strikes.
Immediately, the firm received a call from a pair of students studying abroad, Deputy Vice President of Operations Colin O’Brien told Fox News. He said they were trying to leave Dubai.
‘Within about four and a half hours from the phone call, we had our teams in motion to go pick these people up and it was two college-aged women,’ said O’Brien.
‘Put them in the car, we were then able to move from the Omani border and by eight hours we were at the border. Work through the border checkpoint to a hotel in Muscat, where we could stop and give them a short rest while we arrange their transportation home,’ he says.
The group said it remains active year-round to ensure evacuation plans are in place before disasters strike.
‘There’s a narrative of, here’s the pickup point, here’s the key crossing site,’ Buckner said. ‘This is what you’re gonna need from a paperwork standpoint, legally. And then we’re gonna put you in a hotel or straight onto a commercial flight. Most likely, at this point in the war, we’re gonna put you on a private charter.’
Buckner said most of these missions happening in the region are ground movement, done by locals. He says in the 140 countries the firm is in, they have ground teams working year-round. Consistently training year-round.
‘We’re communicating, we’re coordinating, we’re executing. Executive protection agents, armed agents, armed vehicles, large-scale event support with medical and security personnel,’ he said, describing the firm’s standard operating capabilities.
‘We’re coordinating whether the firm needs drivers. From Dubai to Oman, Israel to either Oman, Jordan or Egypt. Out of Bahrain into Saudi Arabia,’ Buckner said.
While the firm is coordinating with the State Department, it said it has not yet conducted a flight mission on behalf of the department.
Global Guardian offers these services through what it calls a ‘Duty of Care Membership,’ which Buckner said costs $15,000 per year for a family of five.
‘You are going to sign a contract — whether it’s a family, a family office or typically a large corporate logo. Then we become, at your beck and call,’ Buckner said, describing the emergency response services included in the agreement.
For Americans currently stuck in the Middle East, Buckner said the cost of evacuation using ground and air resources varies depending on the situation and location.
Related Article
Trump says defense giants will quadruple production of ‘exquisite class’ weapons after White House meeting
Vital Metals Limited (ASX: VML) (“Vital Metals” or “the Company”) is pleased to report final overlimit assay results from grab samples collected at Nechalacho, confirming exceptional rare earth grades of up to 292,145ppm TREO.
Highlights:
F009416 (target 1029A) returned the highest TREO value recorded at Nechalacho to date (based on Company data) as follows:
29.2% TREO (292,145 ppm), including:
7.0% Nd₂O₃ (70,333 ppm); and
1.7% Pr₆O₁₁ (17,398 ppm).
NdPr oxides totalled 8.7% (87,731 ppm), representing 29.8% of TREO, highly significant as NdPr is typically the highest-value payable component within the light rare earth elements.
F009445 (R Zone target) returned 12.5% TREO (125,920 ppm), including 1.5% Dy₂O₃ (15,609 ppm) and 1.0% Gd₂O₃ (10,719 ppm), representing the highest dysprosium result at the project reported to date.
The excellent assays from the completed regional grab sample exploration program have identified 6 targets located outside of the current resource and demonstrates the significant potential at the Nechalacho Rare Earths and Niobium Project for more discoveries.
A 1000m exploration drill program is now underway at R Zone, S Zone and Cressy Ridge and is expected to be completed by mid-April 2026.
The results demonstrate significant potential to support the district scale of mineralisation across its Nechalacho Rare Earths and Niobium Project (Upper Zone, top 150m RL) located 100km southeast of Yellowknife, Northwest Territories, Canada.
Managing Director and CEO Lisa Riley said:
“These results demonstrate that Nechalacho is a large, dynamic rare earth system rather than a single deposit. Mineralisation has been identified outside the defined US$445m Tardiff Deposit underscoring a broad district-scale multi-target opportunity and supporting our strategy of expanding the resource base beyond Tardiff and North T while advancing Tardiff toward development.”
“We are executing a three-pronged approach:
1. Exploration work on the new targets, expanding the broader Nechalacho footprint.
2. Pre-Feasibility Study of the Tardiff deposit toward completion by February 2027.
3. Preparing to process stockpiles at North T to generate cash as soon as possible.”
Overview of Work Recently Conducted
As announced to the ASX on 23 February 2026, analyses from three grab samples, F009416, F009445 and F009446, were reported with overlimit values (i.e. Nd > 50,000 ppm, Dy >5,000ppm). These samples have since undergone a third round of analysis at ALS Canada, with final certified assay results reported outlined below.
Fresh satellite images give a rare aerial view of the damage across Iran after U.S.-Israeli strikes and what Tehran’s retaliation left behind across the region.
Planet Labs satellite imagery captured burning ships and damaged facilities at the Konarak base in southern Iran, as well as significant destruction at Iran’s naval headquarters in Bandar Abbas on the Persian Gulf, reflecting the scale of the strikes on military infrastructure.
Imagery from Vantor shows damage to facilities and vessels located in Iran’s Bushehr port in the Persian Gulf.
In addition to naval assets, satellite photos show a bunker at Bushehr air base hit by a strike, leaving a large crater and destroying several nearby small buildings.
More strikes targeted the Choqa Balk drone facility in western Iran.
Radar systems at the Zahedan air base in eastern Iran — near the country’s borders with Pakistan and Afghanistan — were also struck.
The two facilities are about 800 to 900 miles apart, underscoring the broad reach of the coordinated strikes.
Satellite imagery also reveals damage to aircraft on the tarmac at Shiraz air base, including scorch marks and debris around several parking areas.
Satellite imagery from Planet Labs shows thick smoke plumes rising above Tehran, signaling explosions and fires inside the Iranian capital.
The smoke underscores how the conflict has moved beyond isolated military sites and into the heart of Iran’s political center.
Iran has since responded with missile and drone strikes of its own, expanding the conflict across the region.
Satellite images reveal damage to the port city of Sharjah in the United Arab Emirates. Sharjah is the third most populous after Dubai and Abu Dhabi.
The Jebel Ali Port, the region’s largest maritime hub, was also targeted, underscoring how the retaliation extended beyond military sites to key infrastructure.
The new satellite imagery comes on the heels of U.S.-Israeli strikes that killed Iran’s supreme leader, Ayatollah Ali Khamenei, and several top members of the regime, triggering a succession crisis.
President Donald Trump warned on Sunday that Iran’s new leader is ‘not going to last long’ without U.S. approval as Operation Epic Fury marches into a third week.
Related Article
Watch shipping through the Strait of Hormuz grind to a halt amid Iran conflict


 Vital Metals Limited (ASX: VML) (“Vital Metals” or “the Company”) is pleased to report final overlimit assay results from grab samples collected at Nechalacho, confirming exceptional rare earth grades of up to 292,145ppm TREO.

 South Harz Potash Limited (SHP:AU) has announced A$1.25 Million Placement to Advance Copper-Gold Exploration