Cartier Resources Inc. (″ Cartier ″ or the ″ Company ″) (TSXV: ECR,OTC:ECRFF; FSE: 6CA) is pleased to announce the ninth batch of results from the 100,000-m drilling program (2 drill rigs), for the Portal Sector, specifically from the North Simon Zone (″ NSZ ″) on the 100%-owned Cadillac Project, located in Val-d’Or (Abitibi, Quebec).
Strategic Highlights from Portal Sector
Drill Hole Results (Figures 1 to 4)
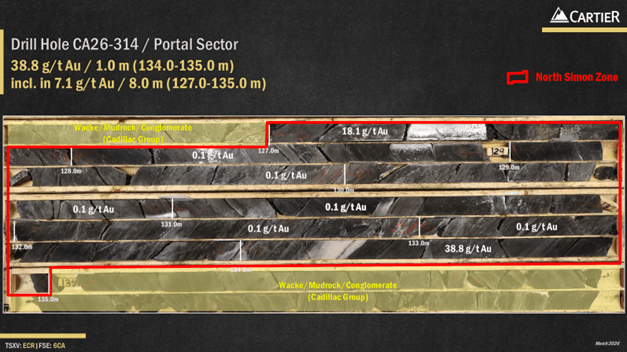
- CA26-314 intersected 7.1 g/t Au over 8.0 m including 38.8 g/t Au over 1.0 m (NS Zone).
- CA26-325 graded 6.8 g/t Au over 2.2 m (NS Zone).
- CA26-308 reported 3.3 g/t Au over 4.2 m (5C5 Zone).
Significance for Investors
- Holes CA26-314 and 325 confirm the newly recognized NSZ high-grade gold zone near surface. The mineralization extends over 200 m in strike length and remains open in all directions, suggesting significant upside exploration potential.
- Most importantly, NSZ is strategically located just 150 metres east of historical ramp. This logistical advantage should enhance the development flexibility and economics of Cadillac Project.
Next Steps
- Further expansion drilling is planned to significantly refine the geological model, verify the mineralization continuity and determine the gold enrichment vectors.
- Additional exploration drilling is required to test several new high-priority regional targets along strike of the Portal Sector and the Cadillac Fault Zone, backed by detailed structural and geological modelling and VRIFY’s artificial intelligence (AI) driven targeting.
‘ These results of Portal Sector are particularly exciting as they confirm the presence of a fourth gold sector with strong exploration potential. Benefiting from the existing road access and historical infrastructure, this new sector has the potential for resource growth while being strategically located with respect to the Main Sector. We believe it could significantly enhance the value of the project and provide additional flexibility as we continue to advance and expand the overall development opportunities.‘ – Ronan Deroff, Vice President Exploration of Cartier.
Table 1: Drill hole best assay results from Portal Sector
| Hole Number |
From (m) |
To (m) |
Core Length** (m) |
Au (g/t) Uncut |
Vertical Depth (m) |
Zone |
| CA26-308 |
122.8 |
127.0 |
4.2 |
3.3 |
≈80 |
5C5 |
| CA26-314 |
127.0 |
135.0 |
8.0 |
7.1* |
≈110
|
NS
|
| Including |
127.0 |
128.0 |
1.0 |
18.1 |
| Including |
134.0 |
135.0 |
1.0 |
38.8* |
| CA26-325 |
29.0 |
31.2 |
2.2 |
6.8 |
≈25
|
NS
|
| Including |
29.0 |
30.0 |
1.0 |
5.8 |
| Including |
30.0 |
31.2 |
1.2 |
7.6 |
* Occurrences of visible gold (VG) have been noted in the drill core at various intervals. ** Based on the observed intercept angles within the drill core, true thicknesses are estimated to represent approximately 50-90% of the reported core length intervals.
Figure 1: Location of the new drill results (regional plan view)
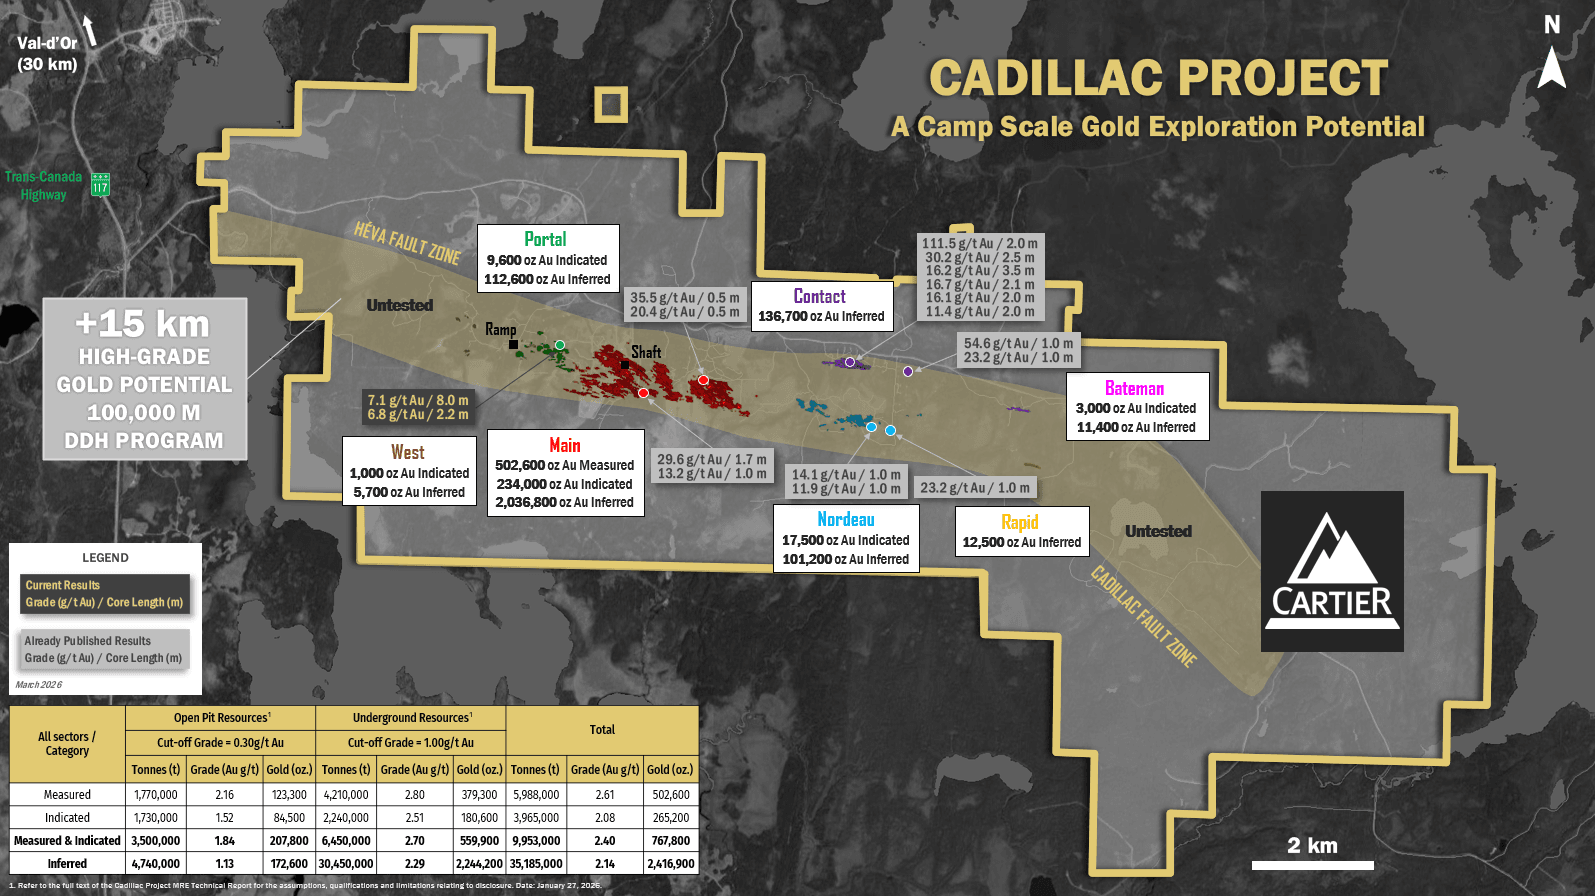
Figure 2: Location of the new drill results (regional longitudinal section)
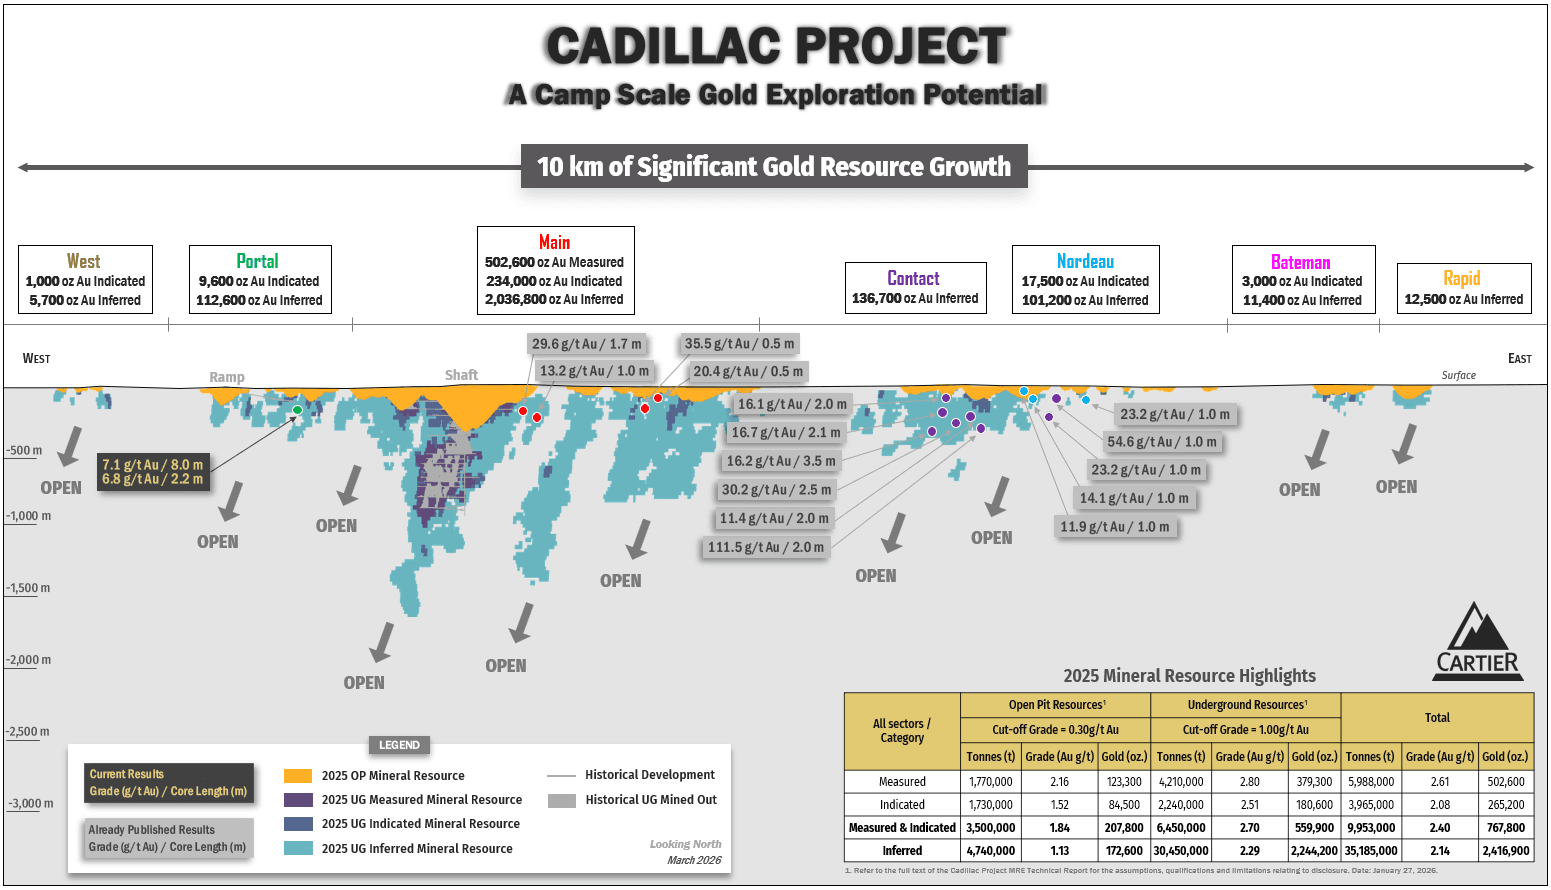
Figure 3: Plan view, cross and long sections of the Portal Sector
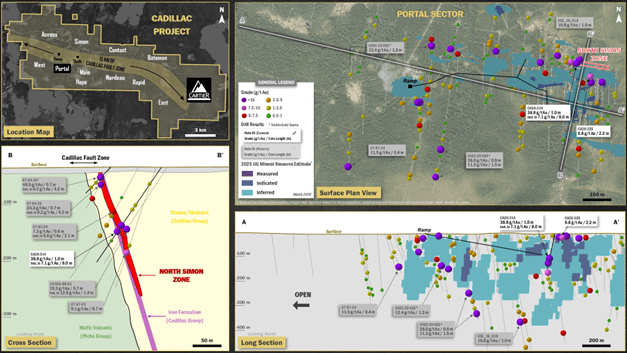
Figure 4: Photos of the drill core from hole CA26-314
Portal Sector
The Portal Sector is a highly prospective area featuring the new North Simon Zone with indicated resources of 9,600 ounces (0.2 million tonnes at 1.9 g/t Au) and inferred resources of 112,600 ounces (1.8 million tonnes at 2.0 g/t Au). The latter is the first ever resource estimate in this sector for which there has been only limited and relatively shallow testing. This sector hosts several newly defined high-priority drill targets.
This sector lies along an east-west trending, strongly sheared corridor (Cadillac Fault Zone) and occurs at the contact between the hanging wall turbiditic sedimentary rocks (wacke-mudrock), locally conglomerates and iron formations of Cadillac Group and the footwall mafic volcanics (basalt) of Piché Group. This lithological unit is a favorable horizon for hydrothermal fluid flow, likely related to synvolcanic gold deposition.
The Portal Sector, defined by at least four parallel gold-rich zones, are typically and primarily associated with a fine-grained and disseminated arsenopyrite-pyrrhotite mineralization, with a pervasive biotite-chlorite-carbonate alteration, all crosscut by late-stage smoky and white quartz vein and veinlet stockworks containing visible gold. Locally, accessory minerals such as pyrite and tourmaline are observed.
Milestones of 2025-2027 Exploration Program
100,000 m Drilling Program (Q3 2025 to Q2 2027)
The ambitious 600-hole drilling program will both expand known gold zones and test new shallow surface high-potential targets. The objective is to unlock the camp-scale, high-grade gold potential along the 15 km Cadillac Fault Zone. It is important to note that Cartier’s recent consolidation of this large land holding offers the unique opportunity in over 90 years for unrestricted exploration.
Environmental Baseline Studies & Economic Evaluation of Chimo mine tailings (Q3 2025 to Q3 2026)
The baseline studies will be divided into two distinct parts which include 1) environmental baseline desktop study and 2) preliminary environmental geochemical characterization. The initial baseline studies will provide a comprehensive understanding of the current environmental conditions and implement operations that minimize environmental impact while optimizing the economic potential of the project. These studies will be supplemented by an initial assessment of the economic potential of the past-producing Chimo mine tailings to determine whether a quantity of gold can be extracted economically.
Metallurgical Sampling and Testwork Program (Q4 2025 to Q1 2026)
The metallurgical testwork program includes defining of expected gold recovery rates and improving historical results from the Chimo deposit, as well as establishing metallurgical recovery data for the first-time for the East Chimo and West Nordeau satellite deposits, where no previous data exists. This comprehensive program will characterize the mineralized material, gold recovery potential and validate optimal grind size defining the most efficient and cost-effective flowsheet. The data generated will directly support optimized project development and have the potential to significantly reduce both capital and operating costs, while also improving the environmental footprint.
Preliminary Economic Assessment (2026)
Internal engineering studies have been initiated to validate a multitude of development scenarios that consider the updated MRE and current market environment. Following the selection of the most optimal scenario, a PEA will be completed which will also build upon the results of the metallurgical testwork program and the environmental baseline studies to unveil the updated development strategy and vision of the project.
Table 2: Drill hole collar coordinates from Portal Sector
| Hole Number |
UTM Easting (m) |
UTM Northing (m) |
Elevation (m) |
Azimuth (°) |
Dip (°) |
Hole Length (m) |
| CA26-308 |
331360 |
5320154 |
340 |
184 |
-44 |
144 |
| CA26-309 |
331360 |
5320154 |
340 |
191 |
-70 |
210 |
| CA26-310 |
331360 |
5320154 |
340 |
231 |
-78 |
261 |
| CA26-311 |
331278 |
5320204 |
338 |
213 |
-48 |
195 |
| CA26-312 |
331278 |
5320204 |
338 |
210 |
-74 |
261 |
| CA26-314 |
330937 |
5320470 |
335 |
207 |
-59 |
171 |
| CA26-315 |
330937 |
5320470 |
335 |
160 |
-70 |
204 |
| CA26-316 |
330937 |
5320470 |
335 |
184 |
-80 |
204 |
| CA26-317 |
330951 |
5320425 |
335 |
219 |
-44 |
120 |
| CA26-318 |
331011 |
5320439 |
335 |
213 |
-66 |
150 |
| CA26-319 |
331011 |
5320439 |
335 |
207 |
-81 |
171 |
| CA26-320 |
331037 |
5320425 |
335 |
188 |
-53 |
117 |
| CA26-323 |
331010 |
5320365 |
335 |
165 |
-46 |
75 |
| CA26-325 |
330946 |
5320385 |
335 |
204 |
-77 |
90 |
Table 3: Drill hole detailed assay results from Portal Sector
| Hole Number |
From (m) |
To (m) |
Core Length* (m) |
Au (g/t) Uncut |
Vertical Depth (m) |
Zone |
| CA26-308 |
88.0 |
89.0 |
1.0 |
1.8 |
≈60 |
– |
| And |
122.8 |
127.0 |
4.2 |
3.3 |
≈80
|
5C5
|
| Including |
122.8 |
123.8 |
1.0 |
4.6 |
| Including |
123.8 |
124.8 |
1.0 |
1.6 |
| Including |
124.8 |
125.8 |
1.0 |
2.9 |
| Including |
125.8 |
126.3 |
0.5 |
5.3 |
| Including |
126.3 |
127.0 |
0.7 |
2.7 |
| CA26-309 |
164.9 |
166.0 |
1.1 |
1.3 |
≈155 |
– |
| And |
188.0 |
189.0 |
1.0 |
1.6 |
≈175 |
5C5 |
| CA26-310 |
242.3 |
243.0 |
0.7 |
4.0* |
≈235 |
5C5 |
| CA26-311 |
142.0 |
143.0 |
1.0 |
1.8 |
≈105 |
– |
| And |
166.0 |
167.0 |
1.0 |
3.5 |
≈125
|
5C5
|
| And |
170.0 |
171.0 |
1.0 |
1.0 |
| And |
177.0 |
178.0 |
1.0 |
2.2 |
| And |
178.0 |
179.0 |
1.0 |
1.0 |
| CA26-312 |
219.0 |
219.5 |
0.5 |
1.2 |
≈210 |
– |
| And |
249.0 |
250.0 |
1.0 |
1.1 |
≈235
|
5C5
|
| And |
251.0 |
252.0 |
1.0 |
1.4 |
| And |
252.0 |
253.0 |
1.0 |
3.1 |
| CA26-314 |
33.0 |
34.0 |
1.0 |
1.1 |
≈30
|
–
|
| And |
34.0 |
35.0 |
1.0 |
1.8 |
| And |
78.0 |
79.0 |
1.0 |
1.0 |
≈70
|
–
|
| And |
81.3 |
82.0 |
0.7 |
2.3 |
| And |
91.5 |
92.0 |
0.5 |
2.1 |
| And |
127.0 |
135.0 |
8.0 |
7.1* |
≈110
|
NS
|
| Including |
127.0 |
128.0 |
1.0 |
18.1 |
| Including |
134.0 |
135.0 |
1.0 |
38.8* |
| CA26-315 |
44.5 |
45.5 |
1.0 |
1.2 |
≈40 |
– |
| And |
80.0 |
81.2 |
1.2 |
3.5 |
≈75 |
– |
| CA26-316 |
194.0 |
195.0 |
1.0 |
1.2 |
≈190
|
NS
|
| And |
197.0 |
198.0 |
1.0 |
1.7 |
| CA26-317 |
70.0 |
71.0 |
1.0 |
1.0 |
≈45 |
– |
| And |
101.0 |
102.0 |
1.0 |
1.5 |
≈65 |
– |
| CA26-318 |
106.0 |
107.0 |
1.0 |
1.2 |
≈95
|
NS
|
| And |
107.0 |
108.0 |
1.0 |
1.5 |
| CA26-319 |
76.0 |
77.0 |
1.0 |
1.2 |
≈75 |
– |
| CA26-320 |
37.0 |
38.0 |
1.0 |
2.0 |
≈25 |
– |
| CA26-323 |
40.5 |
41.5 |
1.0 |
1.0 |
≈30 |
– |
| CA26-325 |
15.0 |
16.0 |
1.0 |
2.7 |
≈15 |
– |
| And |
29.0 |
31.2 |
2.2 |
6.8 |
≈25
|
NS
|
| Including |
29.0 |
30.0 |
1.0 |
5.8 |
| Including |
30.0 |
31.2 |
1.2 |
7.6 |
* Occurrences of visible gold (VG) have been noted in the drill core at various intervals. ** Based on the observed intercept angles within the drill core, true thicknesses are estimated to represent approximately 50-90% of the reported core length intervals.
Quality Assurance and Quality Control (QA/QC) Program
The drill core from the Cadillac Project is NQ-size and, upon receipt from the drill rig, is described and sampled by Cartier geologists. Core is sawn in half, with one half labelled, bagged and submitted for analysis and the other half retained and stored at Cartier’s coreshack facilities located in Val-d’Or, Quebec, for future reference and verification. As part of Quality Assurance and Quality Control (QA/QC) program, Cartier inserts blank samples and certified reference materials (standards) at regular intervals into the sample stream prior to shipment to monitor laboratory performance and analytical accuracy.
Drill core samples are sent to MSALABS’s analytical laboratory located in Val-d’Or, Quebec, for preparation and gold analysis. The entire sample is dried and crushed (70% passing a 2-millimeter sieve). The analysis for gold is performed on an approximately 500 g aliquot using Chrysos Photon Assay technology, which uses high-energy X-ray excitation with gamma detection to quickly and non-destructively measure gold content.
Alternatively, samples are submitted to Activation Laboratories Ltd. (‘Actlabs’), located in either Val-d’Or or Ste-Germaine-Boulé, both in Quebec, for preparation and gold analysis. The entire sample is dried, crushed (90% passing a 2-millimetre sieve) and 250 g is pulverized (90% passing a 0.07-millimetre sieve). The analysis for gold is conducted using a 50 g fire assay fusion with atomic absorption spectroscopy (AAS) finish, with a detection limit up to 10,000 ppb. Samples exceeding this threshold are reanalyzed by fire assay with a gravimetric finish to determine high-grade values accurately.
Both MSALABS and Actlabs are ISO/IEC 17025 accredited for gold assays and implement industry-standard QA/QC protocols. Their internal quality control programs include the use of blanks, duplicates, and certified reference materials at set intervals, with established acceptance criteria to ensure data integrity and analytical precision.
Qualified Person
The scientific and technical content of this press release has been prepared, reviewed and approved by Mr. Ronan Déroff, P.Geo., M.Sc., Vice President Exploration, who is a ″ Qualified Person ″ as defined by National Instrument 43-101 – Standards of Disclosure for Mineral Projects (″ NI 43-101 ″).
About Cadillac Project
The Cadillac Project, covering 14,000 hectares along a 15-kilometre stretch of the Cadillac Fault, is one of the largest consolidated land packages in the Val-d’Or mining camp. Cartier’s flagship asset integrates the historic Chimo Mine and East Cadillac projects, creating a dominant position in a world class gold mining district. With excellent road access, year-round infrastructure and nearby milling capacity, the project is ideally positioned for rapid advancement and value creation.
The Cadillac property contains total gold resource of 767,800 ounces in the measured and indicated category (10.0 Mt at 2.4 g/t Au) and 2,416,900 ounces in the inferred category (35.2 Mt at 2.1 g/t Au) across all the sectors. Please see the ″ NI 43-101 Technical Report and Mineral Resource Estimate on the Cadillac Project, Val-d’Or, Abitibi, Quebec, Canada. Pierre-Luc Richard, P.Geo. of PLR Resources Inc., Stephen Coates, P.Eng. of Evomine Consulting Inc. and Florent Baril, P.Eng. of Bumigeme Inc. ″, effective January 27, 2026.
About Cartier Resources Inc.
Cartier Resources Inc., founded in 2006 and headquartered in Val-d’Or (Quebec) is a gold exploration company focused on building shareholder value through discovery and development in one of Canada’s most prolific mining camps. The Company combines strong technical expertise and a track record of successful exploration to advance its flagship Cadillac Project. Cartier’s strategy is clear: unlock the full potential of one of the largest undeveloped gold landholdings in Quebec.
For further information, contact:
Philippe Cloutier, P. Geo.
President and CEO
Telephone: 819-856-0512
philippe.cloutier@ressourcescartier.com
www.ressourcescartier.com
Neither TSX Venture Exchange nor its Regulation Services Provider (as that term is defined in policies of the TSX Venture Exchange) accepts responsibility for the adequacy or accuracy of this release.
Photos accompanying this announcement are available at:
https://www.globenewswire.com/NewsRoom/AttachmentNg/4a6070a5-433e-49db-b60d-22387d3a3983
https://www.globenewswire.com/NewsRoom/AttachmentNg/ac66c90e-4b27-42fa-ad98-5e596b72c8fe
https://www.globenewswire.com/NewsRoom/AttachmentNg/7db6da4e-0bcb-4ce2-8f3a-c58d2e5cf92c
https://www.globenewswire.com/NewsRoom/AttachmentNg/fa6a3b5f-0360-4d98-becb-946a9f200df1