When a state starts floating an exit tax, it is telling you something more important than any campaign slogan: the people running the place know their model is not working.
They may not say it that way. They will call it fairness, responsibility, or making the wealthy “pay what they owe.” But the meaning is the same.
If families, entrepreneurs, and investors are leaving, the state can either ask why its policies are pushing them out, or it can try to tax them for escaping. An exit tax chooses punishment over reform.
I understand why these proposals resonate with some people. If you are watching wealthy residents relocate while governments still face bills for schools, roads, pensions, and other commitments, it is easy to feel like the people with the most mobility are ducking the tab.
That frustration is real. It deserves a serious answer. But an exit tax is not a serious answer. It is a confession that lawmakers would rather cling to a failing fiscal model than fix the spending, regulation, and tax policies that made people want to leave in the first place.
That is why the current trend is so revealing. In California, proposals have centered on taxing billionaire net worth, including wealth that often exists on paper rather than in cash. In New York, the push has extended to a new surcharge on high-value second homes in New York City.
In Washington, lawmakers have already enacted a “millionaires’ tax.” These policies differ in form, but not in spirit. They all send the same message: if government has made your state too expensive, too hostile, or too unpredictable, it may still try to claim part of your future anyway.
The economics are worse than the politics. Supporters talk as if wealth is a pile of idle cash sitting in a vault, just waiting to be skimmed. It is not. Wealth is usually tied up in businesses, shares, property, and future earnings.
Taxing net worth or unrealized gains means taxing value that often has not been sold, realized, or converted into cash. That can force asset sales, dilute business ownership, weaken investment, and change behavior long before the tax collector ever gets a check.
A Hoover Institution analysis of California’s proposal found that once likely migration responses are considered, the measure could leave the state with a negative net present value of about $25 billion. That is the real lesson: politicians score the tax statically, but the economy does not sit still.
And that is before you get to the broader evidence. The OECD has noted that recurring net wealth taxes have become much less common across advanced economies because they tend to raise less revenue than promised while creating large compliance costs, avoidance incentives, and economic distortions. Countries tried them. Many backed away.
A recent NBER study on Scandinavian wealth taxation found that higher top wealth-tax rates reduced the number of wealthy taxpayers and that many of those taxpayers were business owners whose departure reduced investment, employment, and value-added.
That is the part too often ignored in political talking points. When a state drives out a founder, investor, or employer, it is not just losing one tax return. It is losing future jobs, future capital formation, and future opportunity for everybody else too.
Defenders of exit taxes still fall back on one argument that sounds morally satisfying: these taxpayers benefited from state infrastructure, legal protections, and markets while they lived there, so the state deserves one final cut
But that argument quietly rewrites the relationship between citizen and government. It turns moving into a taxable offense. It says the state retains a lingering claim on your success because you once lived under its jurisdiction. That is a dangerous principle in a federal system built on mobility and competition.
Even in the international arena, exit taxes are controversial, complex, and tied to specific movements of assets or functions across borders. Importing that logic into state tax policy is not modernization. It is escalation.
The problem is not just that these taxes are bad economics. It is that they usually do not stay narrow. Politicians sell them as a tool aimed only at billionaires or luxury homeowners — policy aimed at an applause line. But when the revenue falls short, the scope expands.
One-time wealth taxes become annual property surcharges. “Billionaire” thresholds are expanded to target millionaires and eventually the middle class. “Temporary” taxes become permanent fiscal architecture. New York’s pied-à-terre proposal is a good example of how quickly the logic expands once the principle is accepted.
Frédéric Bastiat warned us to look not just at what is seen, but at what is unseen. We see the tax revenues. That’s a small, visible victory compared to the investment that never happens, the entrepreneur who builds elsewhere, jobs that never arrive — the unseen costs compound.
Exit taxes are built on ignoring all of that.
Claiming an exit tax frames mobility as theft, when it is often a rational response to bad governance. They do not restore prosperity. They steal the opportunity to prosper by doubling down on the very policies that made growth harder in the first place.
If lawmakers want to deter departures, the answer is not a fiscal trap door. It is better policy: lower taxes, lighter regulation, spending restraint, and a serious effort to make their states places where productive people want to stay.
Real economic renewal is more difficult than yet more taxation, but it is also the only approach that works. Exit taxes will not save failing states. They only confirm why people wanted to leave.
“There is a new world order,” Vice President JD Vance recently declared. “There is a new world order in trade; there is a new world order in globalization.”
The shift away from the old US-led order is visible in tariff schedules, export controls, energy contracts, investment screening, and trade agreements being built outside the old free-trade consensus. For decades, globalization was sold as a system of American hegemony, open supply chains, and the belief that economic integration would soften political rivalry. China was the ultimate test of that theory. China became richer without becoming Western. Washington’s answer has not been a return to free trade, but the construction of controlled commerce.
Goods still move, firms still seek markets, and governments still negotiate agreements. What is dying is the idea that trade should be governed primarily by consumers, producers, and prices rather than ministries, security agencies, and negotiated quotas. Free trade is becoming ever more rigidly controlled: managed by states, shaped by security concerns, and increasingly organized through political blocs rather than universal rules of open exchange.
The Bipartisan Turn Against Free Trade
The bipartisan turn away from free trade has been a public-policy blunder that favors politically protected industries while neglecting consumers. That is the snowball effect of government intervention: tariffs generate retaliation, retaliation justifies subsidies, subsidies create managed purchase agreements, and managed agreements necessitate new boards, exemptions, and political bargaining.
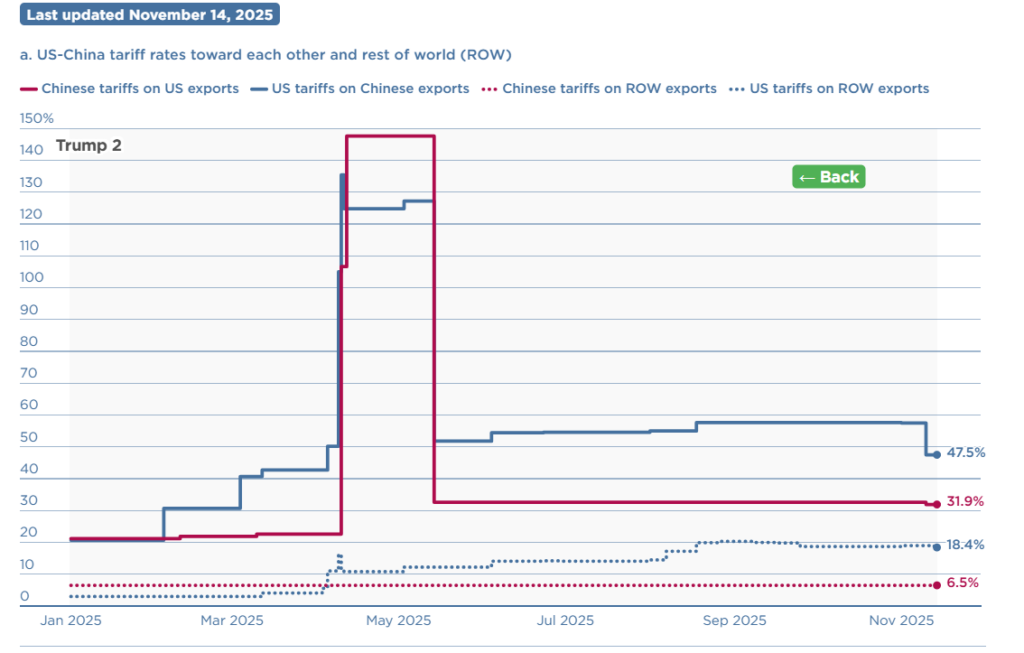
The US–China trade war began under Trump in 2018, remained largely intact under Biden, and has escalated further in Trump’s second term. The contrast is striking: while China lowered its average tariffs on the rest of the world from 8.0 percent in early 2018 to about 6.5 percent by early 2022, the United States raised its average tariffs on the rest of the world from 2.2 percent in January 2018 to 18.4 percent today.
According to PIIE, average US tariffs on Chinese goods stand at 47.5 percent and cover all imports from China, while China’s average tariffs on US goods stand at 31.9 percent. This is no longer temporary leverage. It is structural protectionism.
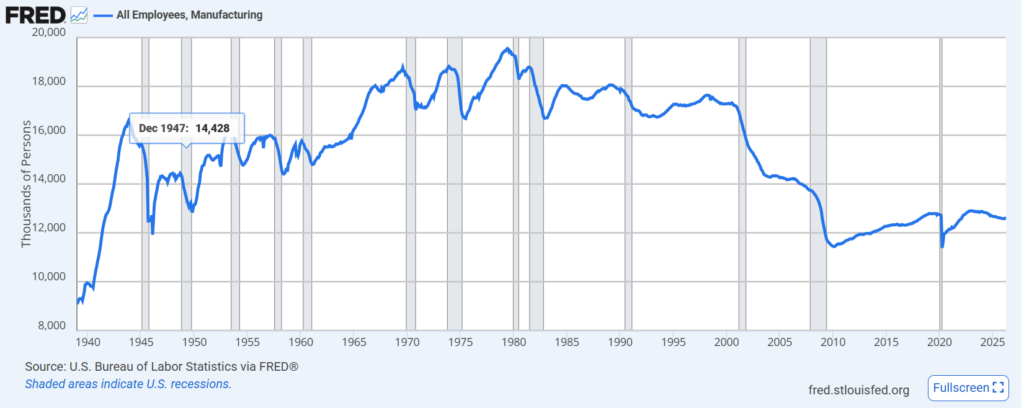
The stated justification for tariffs was that they would revive domestic manufacturing. The manufacturing numbers tell a different story. FRED reports that US manufacturing employment stood at 12.596 million in April 2026. That figure remains far below the old industrial-employment base invoked by “Made in America” rhetoric. Tariffs can make industrial revival sound muscular, but they cannot recreate the manufacturing economy of the late twentieth century. Consumers, meanwhile, pay the costs long before the promised factories arrive, if at all.
Roughly a year after Trump’s so-called “Liberation Day” tariff push, the results remain underwhelming: more federal involvement, more uncertainty, and no return to the industrial employment base politicians promised. The contradiction becomes clearest in Washington’s latest China policy.
Managed Rivalry, Not Free Trade
The current US-China arrangement shows controlled commerce in practice. The White House presented President Trump’s China summit as a historic breakthrough. China agreed to purchase 200 Boeing jets, with Trump suggesting the order could eventually rise to 750 aircraft. Treasury Secretary Scott Bessent stated, “We’re going to talk about a ‘Board of Investment’ that will be responsible for investment in non-sensitive areas.”
A second joint organization is in the making, with the White House Fact Sheet stating, “The Board of Trade will allow the United States Government and the Government of China to manage bilateral trade across non-sensitive goods.” On its face, this looks like a diplomatic victory for American manufacturing and global stability. Beneath the triumphal language, however, sits a more revealing reality. This is not free trade, and it is not market competition. It is state-managed bargaining between rival great powers, a cartel logic applied to global commerce.
Nor was Boeing alone in revealing how corporate access now depends on state diplomacy. Aircraft sales are not being left to open markets alone. They are being negotiated by heads of state, bundled into a broader geopolitical relationship, and tied to questions of supply chains and bilateral stability. The visit, the first by a sitting US president to China in nearly a decade, brought a large corporate delegation to Beijing, including executives from Apple, Tesla, Goldman Sachs, Boeing, Cargill, Visa, Citigroup, Nvidia, BlackRock, and Blackstone. The presence of these firms reveals the contradiction that tariffs promised to bring production home — but the summit was organized around preserving corporate access to China.
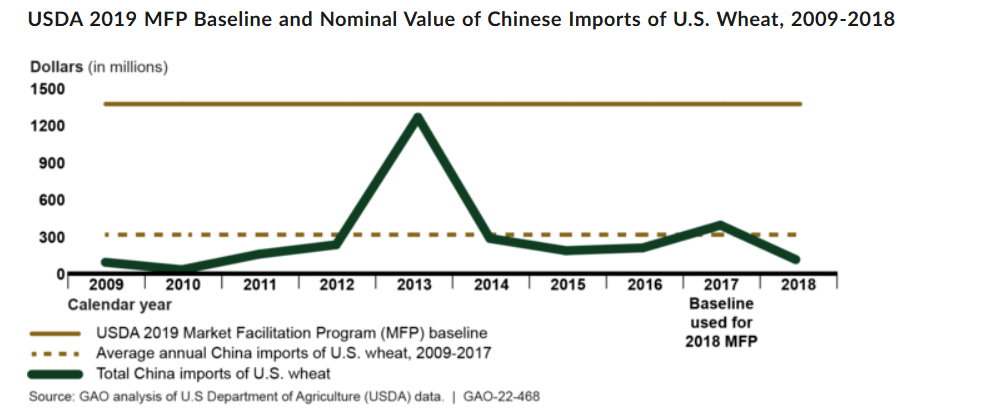
Agriculture shows the same absurdity. In the early trade war, China turned soybeans into a political weapon: after Washington imposed tariffs in 2018, Beijing responded with a 25 percent retaliatory tariff on US soybeans, and US soybean exports to China fell by $9.1 billion that year. A partial recovery in the same sector is being repackaged as a diplomatic victory. US Trade Representative Jamieson Greer has since said he expects “double-digit billion” annual purchases of American agricultural goods over the next three years — roughly restoring the pre-2018 norm.
The deeper lesson is that farmers are increasingly dependent on diplomatic bargaining rather than open markets, powered by political favor rather than productive capacity or entrepreneurial initiative. China can punish, purchase, or redirect demand depending on relations with Washington. That makes domestic subsidies unavoidable.
According to the Government Accountability Office, USDA’s Market Facilitation Program provided $23 billion in 2018 and 2019, including $14.4 billion to about 644,000 operations, comprising more than 800,000 individuals. If Chinese purchases resume while subsidies remain, the result is not a restored free market but a but a narrower, more politicized one, with tariffs, subsidies, and politicians deciding who gets rescued.
The Multipolar Response
America’s turn toward managed rivalry forces other powers to insure themselves. As Washington redirects its attention toward China and the Indo-Pacific, Brussels can no longer assume that the old US-led order will organize global trade on its behalf. The result is not isolation, but bloc-building, with the EU–Mercosur and EU-India trade agreements leading the way.
The EU–Mercosur agreement began provisional application on May 1, 2026, linking the EU with Argentina, Brazil, Paraguay, and Uruguay, creating a trading zone of roughly 700 million people. The agreement supports European exporters by saving firms an estimated €4 billion in customs duties on goods such as car parts, machinery, chemicals, and pharmaceuticals, while also deepening EU access to Latin America’s agricultural products, minerals, and critical raw materials. This is why the European Commission has framed the Mercosur relationship not only as a trade deal, but as part of Europe’s strategy to secure resilient supply chains and reduce strategic dependence.
India offers Europe something Mercosur cannot: scale, services, manufacturing diversification, and Indo-Pacific leverage. After more than a decade of stop-start negotiations, the EU–India agreement is expected to double EU goods exports to India by 2032 and eliminate or reduce tariffs on 96.6 percent of EU goods exports. It is the EU’s most economically significant bilateral trade agreement ever, giving European firms deeper access to the world’s most populous country and one of the fastest-growing major economies.
Both agreements should be read as geopolitical insurance policies. Europe is not just lowering tariffs; it is securing supply chains, diversifying partners, and building leverage as the United States turns inward and toward Asia. These machinations are not “free trade.” They are negotiated corridors of access, hedged by rules, exceptions, quotas, and strategic objectives. Decades of negotiation, rules of origin, tariff schedules, environmental clauses, quotas, and ratification procedures show that the world is moving away from free trade.
French President Macron captured the logic clearly: “In the world we live in — with American tariffs and Chinese overcapacity — we must protect our production capacities.” He added that the objective is, “not to be the vessels of two hegemonic powers.” That is the language of bloc strategy. The “secondary” powers are fully aware of the changing status quo.
The Rise of Managed Globalization in a Multipolar World
Free trade has lost its innocence. The old promise was that open markets would soften rivalry and discipline governments. Instead, the United States tried to liberalize China through trade and found itself managing a powerful rival through tariffs, export controls, aircraft deals, farm purchases, investment boards, and subsidies. Brussels, seeing Washington turn inward and toward Asia, is building its own corridors with Mercosur and India.
This is not the end of globalization, but the end of globalization as a neutral, American-led project. Government intervention, introduced via tariffs, does not stop. Tariffs invite retaliation; retaliation invites subsidies; subsidies invite managed deals; and managed deals invite more bureaucracy. That is controlled commerce: trade still moves, but increasingly through political management rather than open exchange. The world is still trading. It has simply stopped pretending that trade is free from coercive power.
This explainer expands upon the earlier AIER explainer “A Brief History of Federal Transfers” by examining the relationship between federal, state, and local governments shaped by transfers and the incentives they create. Transfers enable the federal government to exert influence over state and local policy beyond what direct legislation — or indeed the Constitution — allows.
It outlines the dangers of centralization created by transfers, provides an overview of federal transfers to state and local governments today, and offers solutions for states to minimize their dependence on federal transfers.
Tocqueville’s Evergreen Warning
In his seminal book Democracy in America, Alexis de Tocqueville distinguishes between two types of state centralization. The first type, governmental centralization, occurs when a national government creates “general laws” and deals with foreign affairs. This form reflects a minimal state, protecting person, property, and promises as well as national security. The second type, administrative centralization, occurs when the national government gains power to “regulate the ordinary affairs of society, to rule the diverse parts of the State in the direction of their special affairs, and to be in charge of the daily details of their existence.”
Administrative centralization always fails, Tocqueville argued, because the task “exceeds human power.” No single person has the necessary knowledge to properly manage these affairs, which leads to “incomplete result or exhausts itself in useless efforts.” Furthermore, while it might produce some “great men of history,” administrative centralization is incapable of securing “the lasting prosperity of a people.” Tocqueville writes that in such planning we see “an element of despotism, but not of lasting national strength.” This unique despotism, which he calls “democratic despotism,” destroys a nation’s character by leaving its citizens “irrevocably in childhood; it likes the citizens to enjoy themselves, provided that they think only about enjoying themselves.”
Nearly two centuries later, his warnings are as salient as ever. The federal government involves itself in myriad state affairs and local minutiae, thanks largely to the growing number of federal grants to state and local governments.
Ideally, the relationship between the federal government and the states would be close to what legal scholar Michael Greve calls “Competitive Federalism.” Greve summarizes Stanford Economist Barry R. Weingast’s parameters of “competitive, ‘market preserving’ federalism,” which emphasize:
State governments underneath a central government have sufficient authority and independence to compete with other states over “some range” of political and economic policies.
States control what happens within their borders, but the central government ensures people and goods can move freely between states to avoid “excessive externalities.”
Transfer payments from the central government to the states are extremely limited.
Today, the US falls short of this model. It suffers from what Greve calls “cartel federalism,” in which the federal and state governments act as “partners in a collective enterprise.” This partnership gives the federal government influence over state and local affairs by using “the production and distribution of rents among politicians, bureaucrats, and concentrated industry sectors.” In return, it softens state and local budget constraints with infusions of federal funds. The result is more centralization and less accountability. Additionally, Greve warns that some forms of decentralization could be pernicious. One such example is the Supreme Court upholding state government interference in national commerce, such as in South Dakota v. Wayfair, Inc. (2018), which permits states to require e-commerce sellers to collect sales tax even if these sellers do not have a physical presence in the state.
In all such cases, the focus is on spending and regulations, rather than solving the problems for which these grants are created in the first place. Despite the clear failings of federal aid, federal policymakers are eager to dole it out and state and local policymakers are eager to accept. The feedback loop reinforces administrative centralization and detracts from individual liberty.
The Constitutional Issues at Stake
The debate over federal transfers reflects a deeper constitutional debate going back to the founding era over the meaning of “promoting the general welfare.” James Madison argued that the meaning of “general welfare” in the preamble must be limited to the Constitution’s enumerated powers. Alexander Hamilton, by contrast, argued for a broader interpretation, claiming that “power ought to be coextensive with all the possible combinations of [the infinite circumstances that endanger the safety of nations].” These two perspectives inevitably carried over into spending and the relationship between federal and state governments.
This same debate entered the discussion of federal transfers in the Supreme Court case South Dakota v. Dole (1987), in which the Supreme Court ruled that Congress may attach conditions to federal funds to influence state policy so long as these conditions promote the “general welfare,” are clearly stated, and are not coercive. In this case, the Court upheld a reduction in highway funding for states that refused to raise the drinking age, calling it “relatively mild encouragement.”
In practice, the Dole framework grants Congress broad latitude to shape state policy indirectly through funding. This issue was revisited in NFIB v. Sebelius (2012), where the Court ruled that threatening states with the loss of all Medicaid funding crossed into coercion. This ruling was narrow and preserved the broader logic of Dole, leaving most conditional funding programs intact.
What appears cooperative is often a system of negotiated dependence, where constitutional doctrine and fiscal incentives work together to shift authority toward the federal government and away from the states.
Why Give Transfers? Why Take Them?
At the federal level, these transfers encourage states to increase spending on issues DC deems important. If state lawmakers were not going to fund something, however, it’s likely because that issue is addressed by the private sector or the costs of such spending exceed any potential benefits.
The “flypaper effect” refers to a phenomenon of states using federal aid for its targeted purpose (i.e., education), only partially reallocating funds to tax cuts or other spending. Evidence is mixed, but the flypaper effect appears strongest wherever interest groups are highly active at the state level and/or where federal grants require matching state funds.
From a political economy perspective, this outcome is predictable. Policymakers respond to incentives embedded in institutional rules. Conditional funding allows Congress to expand influence without a direct mandate, while states adjust policies to secure federal dollars.
Federal transfers also create a transactional form of governance. “There’s a very great danger,” Philip Hamburger comments, “that all institutions will end up being aligned under centralized control” due to the influence of federal transfers with conditional funding.
When federal aid comes into the picture, decision-making becomes distorted. Federal transfers allow states to export some of their burden of funding their own budgets to taxpayers across the country. The cost of spending a dollar is now much less than a dollar for state taxpayers. As a result, states will overspend on federally subsidized activities (especially those that support interest groups) and underspend on other budget priorities, regardless of how state residents value that spending.
The goal of increasing spending to maximize federal dollars also invites a lapse in program security, inviting fraud and abuse. At the beginning of 2026, the federal Department of Health and Human Services froze childcare and family assistance in five states over fraud concerns. Additionally, when federal transfers to the states discourage states from auditing programs for waste, fraud, and abuse, taxpayer dollars get wasted while dependence on the federal government increases. This scenario occurred while the federal COVID-19 stimulus packages were passed, particularly with unemployment insurance and Medicaid. This gave the federal government greater control over these programs and their respective sectors of the economy (i.e., healthcare) while taxpayers must sacrifice additional income to cover the losses these programs incurred.
It also encourages state policymakers to shift costs from their own budgets onto federal balance sheets. This results in many states having the appearance of strong fiscal health while being propped up by federal funds. If federal transfers decrease, many states and cities are likely to experience budget crises.
Jonathan Rodden’s analysis of fiscal federalism finds that this is a predictable outcome of institutional design. Rodden finds that when subnational governments depend on transfers while retaining borrowing and spending autonomy, they can expand programs without fully bearing the cost, also known as a “soft budget constraint.”
Political incentives reinforce this behavior. Policymakers respond to the fiscal rules they operate under as actors that want to maximize resources and avoid hard tradeoffs. When spending decisions are made locally but financed nationally, each state will try to draw as much as possible from federal funds while spreading the costs across the national tax base.
The result is a system that quietly builds fiscal distress beneath a veneer of stability.
The Twenty-First Century: An Era of Federal Dependence
“A Brief History of Federal Transfers to the States” covered the history of federal transfers from the Founding to 1980, but the story continues after the Great Society. A brief respite from ratcheting federal transfers, known as the “Devolution Revolution,” consolidated 77 categorical grants and two block grants into 9 block grants under the Omnibus Budget Reconciliation Act of 1981. Despite this consolidation, federal transfers, particularly for entitlements, continued relatively unabated.
In 1995, the Unfunded Mandate Reform Act brought hope to limiting federal unfunded mandates on state and local governments and the private sector, but its scope was extremely limited, excluding most federal grant conditions and preemptions. By 2000, 653 aid programs to the states existed. Throughout the presidencies of George W. Bush, Barack Obama, and Donald Trump, these programs and their spending steadily increased in the years leading up to the pandemic in 2020.
In 2020 and the years following, state dependence on federal funds increased 63 percent from 2019 to 2021 (the peak of federal transfers during the COVID-19 economic contraction). Even after these programs were reduced, federal spending on state and local governments in 2023 is still $200 billion (constant 2017 dollars) greater than in 2019. Projections from the Congressional Budget Office also anticipate federal transfers to state and local governments to resume a steady increase from 2026-2036. Increased strains on the federal budget, however, will inevitably lead to cuts to state transfer payments (as is being heavily debated in discussions of Medicaid reform) resulting in state governments scrambling to cover billion-dollar funding shortfalls. State policymakers will then likely finance those budget shortfalls with debt to avoid political backlash. Figure 1 shows the average state expenditures as a percentage of total spending since Fiscal Year 1991.
Figure 1: State Expenditures by Type as a Percentage of Total State Expenditures (50 State Average)
Note: These totals include capital spending. Shaded areas indicate periods of recession.
Source: National Association of State Budget Officers (NASBO) State Expenditure Report Historical Data, FRED Database (for inflation indicator), and Author’s Calculations
Hopes of reducing federal influence over states were dashed as both FY 2023 and 2024 state budgets saw a severe decline in revenues. This has meant prolonged dependency on federal taxpayer dollars, which federal policymakers are happy to provide in exchange for submission. While federal funding returned to second place in 2023, nearly one third of the average state spending comes from federal transfers. This gives the federal government a large influence over state policy and softens budget constraints for state policymakers.
Such demands for state submission may occur at unexpected times. In late 2025, Indiana legislators discussed redistricting efforts, with many rejecting a plan proposed by President Trump. In response, a rumor spread of a federal funding freeze (originating from a non-profit outside of the government) if Indiana failed to pass the redistricting map. The mere rumor of such a threat stoked fierce debate in the Indiana legislature. The redistricting map was rejected, and the rumored threat never materialized. The clear lesson, though, is that states are so dependent on federal funding that they can be scared into compliance.
Breaking the Addiction to Federal Transfers
Fiscal discipline will be the best means for states to prepare for the coming cuts. One successful example is the Financial Ready Utah plan. Implemented in 2013, the plan created the state Federal Funds Commission to monitor the effects of federal grants on the state and required state agencies to develop emergency action plans in anticipation of a 5- to 25-percent cut in federal funding.
Additionally, state policymakers can begin tracking the number and type of federal transfers coming into the state. Recently, Indiana Comptroller Elise Nieshalla began a campaign highlighting how excessive national debt comes from overspending, which has drawn many state legislators and organizations to rally to the cause. Comptroller Nieshalla has also highlighted the dangers in her own state with a data transparency portal, noting that 43.48 percent of Indiana state expenses were paid from federal transfers.
Making the extent of state federal dependence on federal funds clear to the public, and the dangers of such dependence, can help states break free from federal funds.
Conclusion
The growth of federal transfers pushes America further from the ideal federalism rooted in competition and autonomy and emboldens a federalism defined by dependence and centralized control. What began as limited fiscal assistance evolved into a powerful mechanism through which the federal government shapes state and local policy, distorts local priorities, and weakens accountability. As fiscal pressures mount in DC, states face a critical choice: continue down the path of dependency or restore their fiscal independence. Reclaiming autonomy and preserving the decentralized system Tocqueville admired starts with ending the dependence on the federal government.
On Friday, Kevin Warsh will be sworn in as the seventeenth Chair of the Federal Reserve Board of Governors, after being confirmed by the Senate in a tight 54-45 vote last week. After a politically contentious end to former Chair Jerome Powell’s term, Warsh must find the just-right policy path to balance economic data favoring monetary cooling and political pressure to turn up the heat.
Since serving on the Board during the financial crisis, Warsh has been known as an inflation hawk. But his tune changed to secure the nod from President Trump, who has not been sheepish about where he wants interest rates: lower. The data make that a difficult deliverable for the newly minted Fed chair.
Inflation remains persistently above the Fed’s two-percent target. According to the latest Consumer Price Index, inflation is 3.3 percent higher than a year ago. Taking out food and piping-hot energy prices due to the Iran conflict still puts inflation at 2.8 percent. And the Producer Price Index, what businesses along the supply chain pay before price pressures hit consumers and show up in CPI, came in at sizzling six percent — the highest since December 2022.
Taken with the recent positive jobs report, the price data has markets thinking rate hikes are more likely by year’s end than cuts. What’s a Warsh Fed to do?
Warsh’s hope had been that a productivity boom from AI would spur enough economic growth to absorb the inflation in the system and allow for the president’s desired interest rate cuts. But there are several complicating factors.
First, the energy price shock and tariffs continue to put pressure on prices. Even if the Fed should look through these supply shocks, the calculus changes when those shocks start changing people’s expectations on the demand side.
Second, price pressures are coming from the demand side. This can be seen in two places. Consumer services prices — which are largely driven by items not directly impacted by tariffs or energy, like shelter, medical services, and auto insurance — are up 3.3 percent. And overall spending in the economy, a good proxy for aggregate demand, is exceeding its neutral level. For both gauges of demand-side pressure, the culprit here is the Fed’s rate cuts in late 2024 and late 2025 — not the latest supply shocks.
Between the Middle East conflict pushing up energy prices, tariff prices being passed on to consumers, and the Fed having pumped more money into the economy, it’s no surprise that inflation and inflation expectations are on the rise.
Importantly, as inflation rises, real interest rates will passively loosen monetary policy — without the Fed doing a thing.
Since real interest rates are equal to nominal interest rates minus inflation, as inflation gets higher and nominal rates stay the same, real rates decrease and ease monetary conditions. For example, if you take the nominal federal funds rate of 3.63 percent and subtract inflation of 3.5 percent (using the Fed’s preferred PCE metric), real rates are a mere 0.13 percent. That’s more than 50 basis points lower than in January. As it stands, the Fed may need to tighten just to stay neutral.
It’s a tough environment for Warsh to be selling rate cuts in, to be sure. It’s an even tougher pitch to convince the President that rate hikes are needed to offset growing price pressures.
Warsh is in a bit of a muddle. But he could turn it to his advantage. The Fed has multiple tools to make monetary policy less easy. Its interest rate target is only one. Another is its balance sheet.
The Fed’s large balance sheet has long been a bugbear to Warsh. He has been critical of the Fed for not having reduced it sufficiently post-financial crisis and giving the Fed an outsized credit footprint in the economy. In an environment where tightening is called for but rate hikes are politically unpalatable, the Fed can shrink its balance sheet. It can do so gradually by resuming its passive quantitative tightening — letting maturing assets roll off, or by selling.
On a spectrum of palatability, selling assets is probably even more sour than hiking rates to both Trump and financial markets. But choosing a passive runoff may be just the solution for an economy in need of monetary tempering, while a president demands low rates and financial markets worry.
If his first monetary decision is between a passive balance sheet runoff or deliberate interest rate hikes, Warsh will be in much less hot water if he chooses the balance sheet path.
Can Warsh convince other Fed officials to come along? Several Federal Open Market Committee (FOMC) voting members already wanted to remove the easing bias in the FOMC statement. With new data showing a steady labor market, inflation starting to scald, a resilient consumer, and strong economic growth, those members may support some tempering using the balance sheet.
At a minimum, as soon as the next FOMC meeting in June, the easing language in the Fed’s statement will likely come out. Signaling a passive balance sheet runoff next would be the simplest step back toward a neutral monetary policy stance and show that Warsh is already delivering on (some) of his promises.
On the other hand, if a Warsh Fed continues the Powell Fed’s “wait and see” approach, it risks repeating the Fed’s late-to-the-inflation-party performance post-pandemic. We already know that the monetary punch is hot. While the president and financial markets might complain that rate hikes are too cold, the Fed should at least water things down by letting the balance sheet run off. If it waits, the alternative will be a bucket of ice in massive rate hikes like Powell dumped in 2022. Warsh should prefer to cool the punch bowl down now before he’s forced to whisk it away.
Is libertarianism cracking up? Pick almost any contested political issue of the moment, and you’ll find prominent self-identified libertarians on opposite sides of it. On immigration, the Cato Institute’s Ilya Somin has spent the last several years arguing that libertarian principles require something close to open borders. Lew Rockwell, founder of the Mises Institute, has spent the same years arguing that they require the opposite. On Israel and Gaza, Walter Block has been an unabashed defender of Israel’s military operations on libertarian grounds; Dave Smith, working from what he takes to be the same principles, has been an equally vocal critic.
On the larger question of whether libertarianism should renew its old fusionist alliance with cultural conservatism, Reason‘s Stephanie Slade has made a careful and sympathetic case for fusionism — including in a forthcoming book of that name; her colleague Elizabeth Nolan Brown has been a consistent voice for the more “libertine,” socially liberal version of the tradition. None of these disputes is between a “real” libertarian and an impostor. Each is between recognized, self-identified libertarians who reach opposite conclusions about what libertarian principles require. Are these still the same movement?
The instinctive answer, in each of these disputes, is to say no — that whichever side has reached the unfamiliar conclusion has stopped being libertarian in any meaningful sense. Each camp accuses the other of having abandoned the tradition’s true principles, each is sure it knows what those principles require, and each writes the other out of the family. I want to suggest a less satisfying but more honest answer: that the disputants on both sides of these arguments are continuous with the libertarian tradition, and the reason none of these disputes admit of clean resolution is that the tradition was never as philosophically coherent as libertarians have tended to assume.
Coalitions and Competing Creeds
The most useful lens I’ve found for thinking about this comes from a recent book by Hyrum and Verlan Lewis called The Myth of Left and Right. The Lewis brothers argue that “left” and “right” aren’t coherent ideologies. They’re tribes — coalitions whose positions shift across time and place because the tribes come first and the philosophies get reverse-engineered to fit. Conservatives went from being free traders to protectionists, hawks on Russia to doves, opponents of federal power to its champions, and the shifts only look puzzling if you assume there’s a fixed essence underneath the label. There isn’t. The Lewis brothers aren’t writing about libertarianism. But their framework predicts exactly the kind of fracturing libertarianism is now visibly going through.
As John Tomasi and I document in The Individualists, the history of the libertarian intellectual tradition bears this out. The term “libertarian” first emerged in the 1850s as a self-description for a French anarcho-communist who thought private property and the state were two sides of the same coin. By 1913, Charles Sprading was using it to describe a tent that included Republicans, Democrats, Socialists, Single-Taxers, Anarchists, and Women’s Rights advocates. By the mid-twentieth century, under the influence of Leonard Read and the Foundation for Economic Education, it had narrowed to mean support for free markets and limited government. By the 1970s, the Nozick-Rand-Rothbard synthesis had narrowed it further still — to a particular form of rationalist, rights-based, free-market absolutism. Then, in the 1990s and 2000s, the label fragmented again. Bleeding-heart libertarians, left-libertarians, paleolibertarians, neoreactionaries — all under the same tent, none in agreement about what the tent contains. The current crackup isn’t an aberration. It’s what libertarianism has always done.
This wouldn’t be possible if libertarian principles really did the work of generating definite political conclusions. They don’t. Consider property rights, the closest thing libertarianism has to a settled core. Libertarians who all claim to be defending property rights have disagreed radically about what those rights require. Spencer and Spooner thought intellectual property was a straightforward extension of property rights; Benjamin Tucker thought it was an affront to them. Henry George thought land was categorically different from other property, justly owned by the community; Rothbard called that view “intellectually and morally beneath contempt.” Benjamin Tucker thought legitimate property in land required ongoing occupancy and use; Nozick thought original appropriation generated permanent rights. The principles do some real work — they rule out, for example, the more extreme forms of state socialism. But they aren’t powerful enough to settle the contested questions of our politics. A commitment to property rights doesn’t tell you what property is, how it gets acquired, whether it’s inheritable, or what to do when property-based claims conflict.
A Faustian Bargain?
This indeterminacy is on vivid display in the live debate now consuming much of the libertarian world: whether libertarians can legitimately make use of illiberal means to advance liberal ends. One wing of the movement has rallied behind the administration’s assault on the administrative state. Randy Barnett — the constitutional scholar who led the legal challenge to Obamacare — has urged libertarians to take the methods on display seriously rather than dismiss them. On a February 2025 Reason podcast that posed the question directly — should libertarians celebrate or be concerned about DOGE? — Barnett’s answer was substantially the former: that the regulatory state has grown so insulated from democratic accountability that breaking it open by executive action is constitutionally defensible and strategically welcome. In a New York Times op-ed with Ilan Wurman the same month, he argued that Trump’s executive order ending birthright citizenship for the children of unlawful immigrants has “the better of the constitutional argument.” Behind these specific positions lies what Barnett has elsewhere called the need for a libertarian “theory of the second best” — a libertarianism better fitted to a nonideal world of competing nations and entrenched institutions, willing to take the imperfect openings that real politics offers rather than insist on a first-best that isn’t on the menu.
The other wing has reached the opposite conclusion. In a February 2026 New York Times op-ed titled “Libertarians: We Told You So,” Reason editor Katherine Mangu-Ward argued that Trump-era governance has “vindicated libertarian warnings about executive power, civil liberties, and the risks of trading principle for partisan advantage.” The accusation cuts both ways: the wing that has cheered DOGE has, in her telling, sold the libertarian commitment to limited and accountable government for a temporary regulatory victory. Writing in The Bulwark, UnPopulist editor Shikha Dalmia put it more bluntly. Libertarians, she argued, “have abdicated just when they were most needed” — and the movement is “becoming a zombie ideology, unable to draw fresh moral sustenance even as it uses up its existing reserves.”
Similar fault lines have opened up over tariffs, deportation, and the administration’s treatment of universities and law firms. Reason senior editor Brian Doherty wrote that Trump’s first year had been “a libertarian nightmare.” Jack Hunter, writing in AIER’s own Fusion, called the same year “a libertarian triumph.” Both sides cite libertarian principles. Both believe themselves to be the legitimate heirs of the tradition. The dispute isn’t a disagreement about whether liberty matters; it’s a disagreement about institutional pathways, empirical bets, and which sociological anchors a libertarian’s instincts should track.
That’s the live form of the indeterminacy. It can’t be resolved by appealing to first principles, because the first principles are exactly what both sides claim to be defending. It can only be resolved — to the extent it can be resolved — by careful argument about particular questions: what executive power actually does to constitutional order over time, what immigration restrictions actually do to economic and political freedom, what alliances with the cultural right actually do to the prospects of liberty in the long run. Those are empirical and prudential questions. They aren’t axiomatic ones, and treating them as if they were is what gives the current crackup its bitter, unproductive character.
The Case for Intellectual Humility
What does all this mean for those of us who still call ourselves libertarians? Not, I think, that we should give up the label. The libertarian tradition contains real philosophical insights and remains a powerful corrective to the centralizing instincts of modern politics.
It does mean, however, that we should hold our libertarian views in a somewhat different spirit — less as conclusions deduced from a single axiom, more as provisional positions arrived at through careful thinking about particular issues, with libertarian principles as one important input among others. On some questions that thinking will yield confident conclusions. On many it will yield humility. That, I’ve come to believe, is the stance that actually follows from taking libertarian principles seriously, once you see that they were never powerful enough to do the work that ideological certainty requires of them.
High school history curricula often portray feudalism as a quaint medieval relic — a cautionary archetype of concentrated power, conditional rights, and extractive hierarchies that suppressed human flourishing for centuries. As ever, though, the deeper lesson of history is its recurring nature: when property rights erode and rent-seeking supplants open competition, societies reliably drift back toward feudal arrangements.
American medicine today offers a vivid illustration of this pattern, as government-created barriers sustain local monopolies, nonprofit hospital systems function as modern lords, and physicians relinquish professional autonomy in exchange for the illusory security of salaried fiefdoms. The result is contemporary serfs in white coats serving within tax-exempt citadels.
A Primer On Feudalism
In the medieval manor, a lord granted a vassal a fief — a plot of land — in exchange for loyalty, military service, and a share of the harvest. Serfs tilled the soil with little claim to its fruits. The system was rigid, hierarchical, and extractive. Today, a parallel structure has emerged in American healthcare, not through sword and oath but through certificates of need, Medicare payment rules, and tax-exempt status amidst the backdrop of massive mergers and acquisitions.
Non-profit hospital systems function as modern feudal lords. Physicians have become their vassals, granted small fiefdoms — department chairs, service-line leadership roles, or simply in employed practices — in return for allegiance to the system’s revenue machine. This is the neofeudalism of medicine, born out of crony capitalism and regulatory capture.
Feudalism’s formal titles — king, duke, baron, knight, vassal, serf — reflected a chain of reciprocal obligations rooted in land tenure. Lords owned the means of production; vassals administered justice and defense; serfs provided labor. The system endured for centuries because property rights were conditional and fragmented. Allodial title — true private ownership free of feudal dues — was rare. Markets were stifled. Innovation lagged. The decline of feudalism accelerated in the late Middle Ages and early modern period precisely because secure private property rights emerged. The rise of towns, the enclosure movement, and the commercialization of agriculture allowed individuals to own, improve, and trade land outright. Money economies replaced barter and service. The bourgeoisie accumulated capital. Centralized monarchies and later liberal states enforced contracts and reduced arbitrary exactions. As Douglass North and other institutional economists have shown, well-defined, transferable property rights unleashed entrepreneurship and growth. Serfdom withered not because of royal decree alone, but because free exchange proved more productive. Feudal ties dissolved when individuals could keep the full fruits of their labor.
Medicine’s Drift to Neo-Feudalism
Medicine once mirrored this liberalizing trend. Post-World War II, most physicians owned or partnered in independent practices. They controlled their schedules, negotiated directly with patients and insurers, and bore the risks and rewards of their craft. Private property in medical practice — autonomy over one’s office, staff, and patient relationships — fostered competition and innovation. That world is vanishing. Today, nearly 78 percent of US physicians are employees of hospitals, health systems, or corporate entities. Private practice has collapsed into a shrinking remnant.
The new lords are sprawling tax-exempt “non-profit” health systems. These entities enjoy at least $37 billion annually in federal and state tax breaks — property, income, and sales tax exemptions — while operating with margins and executive compensation packages that rival for-profit corporations. Many run massive investment portfolios and for-profit subsidiaries. Their community-benefit spending often falls short of the value of their exemptions when measured rigorously; some profitable systems deliver minimal charity care relative to their tax windfall.
Government policy supplies the moat around these castles. Rule after rule and regulation after regulation favors the big conglomerates. The regulatory reach adds to the lords’ dominion.
Certificate-of-need (CON) laws are still on the books in about 35 states plus DC, requiring regulatory approval before new hospitals, surgery centers, or even MRI machines can open. Incumbent systems predictably oppose competitors’ applications, turning state boards into tools of rent-seeking protection. Without CON, independent physicians and ambulatory centers could challenge hospital dominance. With it, local monopolies flourish.
Once entrenched, these systems wield two powerful economic weapons: the 340B Drug Pricing Program and site-of-service payment differentials. Enacted in 1992 to help safety-net providers serve low-income patients, 340B allows qualifying hospitals to purchase outpatient drugs at steep discounts — often 20-50 percent or more — then bill insurers or Medicare at full list price. In 2024, covered entities purchased $81.4 billion in 340B drugs. But studies and reports show the windfall frequently funds facility expansion, acquisitions, and executive pay rather than expanded charity care for the intended populations. Contract pharmacies amplify the arbitrage. The program has become a hidden tax on patients, employers, and manufacturers, with limited transparency on how savings reach the vulnerable.
Site-of-service differentials complete the trap. Medicare — and many commercial payers — reimburse the identical service at dramatically higher rates when performed in a hospital outpatient department (HOPD) instead of a physician’s independent office. A clinic visit, imaging study, or minor procedure in an HOPD can command 125 to 300 percent more reimbursement. Hospitals therefore acquire physician practices, rebrand them as HOPDs, and capture the facility-fee markup. Patients are sometimes seeing the same doctor in the same building but for twice as much.
Physicians are increasingly likely to be employed by these healthcare entities — not because they want to, but because the structure and rules are tilted that way.
The physician receives a salary or production bonus but loses ownership. The patient pays higher coinsurance. Independent practices cannot compete on price because the payment rules themselves favor the hospital flag. Vertical integration explodes. Horizontal mergers compound the effect. Markets once served by several competing hospitals see them consolidate into single dominant systems: one or two health systems control the entire market for inpatient care in half of American cities. Research consistently shows that such mergers raise prices five to 20 percent or more — with little or no improvement, and sometimes deterioration, in quality. Cross-market mergers demonstrate similar price effects after several years.
The physician-vassal’s daily reality reflects the bargain. A neurosurgeon or cardiologist may receive a competitive base salary, malpractice coverage, and administrative relief from his affiliation with a hospital. In return, the doctor must (directly or indirectly) refer patients only within the system, meet RVU targets that prioritize volume over value, and accept corporate dictates on electronic health records and formulary restrictions. They must accept care pathways optimized for margins, rather than patient outcomes. Dissent risks contract non-renewal, often triggering noncompete clauses.
True entrepreneurship — opening an ambulatory surgery center or cash-pay spine clinic — requires profound courage and near-inevitable litigation within the framework of CON. The independent doctor who once embodied the free professional has become a salaried cog in a revenue-extracting machine.
A Freer Alternative
Reversing neofeudalism in medicine demands restoring property rights and competition — the very forces that ended medieval feudalism. Policymakers should repeal CON laws nationwide, as several states already have with measurable price reductions and new market players. Implement full site-neutral Medicare payment for outpatient services, leveling the field so independent practices can survive. Reform 340B with transparency mandates, patient-definition tightening, and caps on windfall profits unrelated to charity care. Stop the unnecessary ban on physician-owned hospitals that provide better care at cheaper costs. Antitrust enforcement must scrutinize both horizontal and vertical mergers with renewed vigor. Tax-exempt status for hospitals should be performance-based, tied to verifiable charity care and community benefit exceeding the exemption’s dollar value.
Physicians are not serfs by nature; they are highly trained entrepreneurs stifled by regulation. Patients deserve choice, not tribute to the local castle. The same free market principles that dismantled feudalism can dismantle this one — if policymakers have the courage to let property rights and competition do their work. The alternative is a healthcare system where lords grow richer, vassals grow compliant, and everyone else pays the price.
Judging by the headlines, Ted Turner, who died earlier this month at age 87, will be remembered as an adventurer and visionary: creator of CNN, and with it the 24-hour news cycle, the inventor of the satellite-supported national TV superstation, a distinguished sailor, a generous conservationist, and a reputed playboy. He adored women so much that he produced five children with them, incidentally breaking faith with one of his core values: population control.
When Turner was born on the eve of the Second World War, just over two billion people inhabited the earth. That number increased three-fold by 2000. For Turner, who had internalized the cataclysmic “overpopulation” fears of the Cold War, such growth in living, breathing souls was not a success, but a looming catastrophe. His goal was to first “stabilize the population,” then ideally reduce it to around two billion.
Toward his vision of a world with fewer children, Turner was a generous donor to the United Nations Population Fund (UNFPA), Planned Parenthood, and the Guttmacher Institute. In 2004, the Planned Parenthood Federation of America presented him with the Margaret Sanger Award, which recognizes “leadership, excellence, and outstanding contributions to the reproductive health and rights movement.”
Turner wasn’t the only billionaire philanthropist pouring money into population control. In 2009, he met privately in New York City with Bill Gates, David Rockefeller, George Soros, Warren Buffett, and others to discuss how they could use their wealth to curb overpopulation and fight climate change. They were known as the “Good Club,” The Guardian reported, and they wanted to “save the world.”
Despite their anxieties about other people’s fecundity, the neo-Malthusian billionaires in attendance had, like Turner, been quite fruitful in their own reproductive behavior: Rockefeller had six children; Soros had five; and Gates and Buffett each had three. While sources described Gates as the “most impressive” speaker, Turner was the most outspoken and attempted to “dominate” the meeting.
His outspoken rhetoric certainly wasn’t limited to elite secret gatherings. At a climate luncheon in 2010, he urged world leaders to adopt China’s one-child policy, insisting that, “If we’re going to be here [as a species] 5,000 years from now, we’re not going to do it with seven billion people.”
While lauded as an optimist, Turner believed humans were headed for a nightmare future unless they took drastic action against alleged overpopulation and climate change. He predicted a doomsday scenario of civilizational collapse, with famine, death, cannibalism, and very few survivors living in a “failed state like Somalia or Sudan.” The earth’s temperature is rising, he claimed, because “too many people are using too much stuff.”
Meanwhile, as an adventurer, he afforded himself a lavish and abundant lifestyle, flying his Bombardier Challenger 300 private jet a distance of nearly 80,000 miles in 2022 alone. His aircraft that year surpassed the combined emissions of 34 average Americans.
Turner’s hypocritical and apocalyptic mindset reflected the zero-sum ideology of twentieth-century neo-Malthusians such as Stanford biologist Paul Ehrlich, co-author of the 1968 bestseller The Population Bomb, which boldly asserted that hundreds of millions of people would starve to death in the 1970s due to overpopulation. Turner admired Ehrlich and derived his two-billion world population ideal from Ehrlich’s estimation of earth’s “carrying capacity.”
This outlook received bipartisan support in Washington throughout the 1960s and 1970s among “Rockefeller Republicans” like Gerald Ford and Henry Kissinger as well as environmentalist Democrats like Jimmy Carter. Neo-Malthusian ideas were institutionalized within the State Department and USAID, operating under the misguided assumption that rapid population growth inhibited economic development and constituted a threat to US national security and economic interests. Food aid was even conditioned on developing countries’ willingness to implement population control policies.
The neo-Malthusian consensus wasn’t shattered until the Reagan administration declared rapid population growth a “neutral phenomenon” rather than a barrier to development at the UN’s 1984 World Population Conference in Mexico City. Economist Julian Simon, who argued that “the ultimate resource is people,” was instrumental in shaping the Reagan administration’s renewed approach to population policy.
In 1990, Simon triumphed over Paul Ehrlich in a ten-year wager on the prices of five metals. Ehrlich, betting that population pressures would diminish resources and spike commodity prices, lost to Simon’s more optimistic view that human knowledge, innovation, and resource substitution would produce greater abundance and lower prices over time.
Simon is no less correct today than he was in 1980 when his wager against Ehrlich began. The “time prices” of basic commodities — denoting the amount of time someone must work to earn enough money to purchase a given item — have continued to shrink, owing much to population growth and the expansion of the rule of law, property rights, and economic freedom.
Contrary to the assumptions of Turner and the neo-Malthusians, population growth hasn’t exacerbated famine, poverty, and disease. Nor has it necessarily hastened global warming. As economists Dean Spears and Michael Geruso documented in their 2025 book After the Spike: Population, Progress, and the Case for People, no theoretical or historical relationship exists between population size and particulate air pollution. Whether the human population stabilizes or declines, global warming is forecast to proceed. “Billions of lives lived would make a small difference to this big problem,” they said.
Addressing and overcoming challenges like climate change requires sustained technological progress, which is enabled by more free minds, not fewer. Turner wanted to limit both human numbers and human freedom, but his Malthusian views embodied a discredited consensus that applied a yeast-in-a-petri-dish model to the study of human population.
This dismal perspective, which assumes people will breed themselves into oblivion, doesn’t take into account the better angels of our nature: our rationality, ingenuity, and adaptability unparalleled by any other species. But it reveals a lot about how Malthusians think about their fellow humans — not as sovereign individuals possessing inherent rights and dignity, but rather as an infestation requiring systemic control. As Julian Simon pointed out, this worldview isn’t predicated on scientific facts but on “value judgments about the worth of human life.”
Simon’s intellectual archnemesis, Paul Ehrlich, preceded Turner in death by less than two months. These two Malthusian giants departed our resourceful earth at a time when roughly two-thirds of people live in countries with sub-replacement fertility rates, meaning the average woman is having fewer than 2.1 children. The depopulation they so fervently sought — and funded — has at last become a reality.
But it comes at a price. Countries are not only facing spiraling debt and deficits spurred by population aging and worker shortages, but also a dearth of love, care, and support for the elderly. In countries like Japan, those who fulfilled Turner’s wish and had only one child — or perhaps none — are increasingly dying alone and undiscovered for days, weeks, or even months. It’s a sad and overlooked outcome of depopulation, but luckily for Turner, who suffered from Lewy body dementia, he had five children, along with billions of dollars, to support him in his final years of decline and dependency.
When Henry Hazlitt wrote in Economics In One Lesson that “Economics is haunted by more fallacies than any other study known to man” he knew what he was talking about. Economic fallacies abound — and are even popular. What’s worse, economic illiteracy seems to only increase. In part, this is due to economists trying too hard to be scientific and help policymakers engineer the economy.
Many consider the well-known words of Lord Kelvin obvious, that “when you can measure what you are speaking about, and express it in numbers, you know something about it; but when you cannot measure it, when you cannot express it in numbers, your knowledge is of a meagre and unsatisfactory kind.” That sentiment has been taken to heart by many in the sciences, both natural and social, and also in economics.
After all, without the ability and use of mathematics and statistical data analysis, science would not be able to contribute much knowledge at all. Yet there are limits to the usefulness of measures, as Goodhart’s Law suggests: “When a measure becomes a target, it ceases to be a good measure.”
It is actually even worse in economics, where the use of measures can arguably be a cause of widespread economic illiteracy.
An example of this is the frequent references to inflation in the business press. Experts eagerly note how anything from weakening demand to supply shocks and trade policy will change the inflation rate. The same can be claimed about economic growth, which apparently can not only be generated by economic policy but where government spending “causes” or is essential for economic growth — regardless of how the money is spent.
Both are examples of how economic understanding suffers from what Charles Goodhart recognizes. Inflation is real and so is economic growth, but both are economic concepts with real meaning. In order to investigate them, economists invented statistical constructs — the CPI and GDP, respectively — to simulate approximate measures of the concepts. But both are imperfect.
Inflation used to be understood by economists as the general rise in prices due to the dilution of money. Hence Milton Friedman’s claim that “inflation is always and everywhere a monetary phenomenon.” Prices always fluctuate, but that is just the market’s price mechanism. Inflation was distinct: the effect on prices overall from meddling with money (basically, counterfeiting).
Economic growth explains the increase in the wealth of a nation, which economists understand as the productive capacity. When this capacity increases, the economy can more easily satisfy consumers’ wants. We are richer as a result.
In both cases, the measures are fundamentally flawed but provide some insight into change over time. The CPI captures some of the general rise in prices, but looks at the outcome without recognizing the cause. This has misled people, experts and laymen alike, to believe that increasing prices means inflation. But rising prices can have many causes, often entirely normal upstream effects. A sad result of attempting to measure the outcome is that, for example, a war that affects production “creates inflation.” But higher oil prices are not inflation. This is something that no reasonable economist would have even considered, but now it is presented as a supposed “insight.”
Similarly, the GDP gives an indication of an economy’s productive capacity, but also includes government spending on supposed public goods that are heavily subsidized or provided “for free.” In other words, it appears as if government spending, regardless of what the money is spent on, “creates growth” because it increases GDP. Such spending does not need to actually increase productive capacity — it can even harm productivity — yet still be interpreted as “economic growth” because of its effect on statistics.
Both are examples of how Goodhart’s Law applies — and in fact undermines our economic understanding. This is readily recognizable in how supposed experts claim that price ceilings, or any government effort to control prices (usually by prohibiting high prices), “fights inflation” or that government waste (by virtue of spending) “contributes to economic growth.” They focus entirely on the official statistic, which was originally a poor measurement of a well-understood economic concept, and anything that affects this statistic. But the understanding of the concept is all but lost. And, in fact, they run with it and in the process invent new economic fallacies in order to come across as insightful.
Economics thus remains haunted by fallacies. Rather than dispelling the fallacies or informing policy, some economic indicators and their analyses generate economic illiteracy.
Bandar Abbas, April 2026. The tanker captain knows this route well. He has sailed it a hundred times — through the Strait of Hormuz, into the Gulf of Oman, west toward the refineries. This month, he cannot sail it at all. Conflict has choked the world’s most important oil corridor. Roughly nine million barrels per day, nearly a tenth of global supply, disappeared almost overnight.
In earlier decades, a disruption like this would have been painful but manageable. Strategic reserves, spare production capacity, and diversified supply chains would have softened the blow. This time, Brent crude surged above $100 per barrel, diesel approached $6 per gallon, and inventories fell below their five-year average. The cushion was gone.
What happened in the Strait of Hormuz is not terribly unusual. Geopolitical shocks to supply are as old as oil markets themselves. But why, this time, did the global energy system have so little capacity left to absorb one? The answer lies not in the Persian Gulf, but in two decades of policy that steadily dismantled the capital structure of the fuels the world still depends on, while simultaneously obstructing the only scalable alternative capable of replacing them.
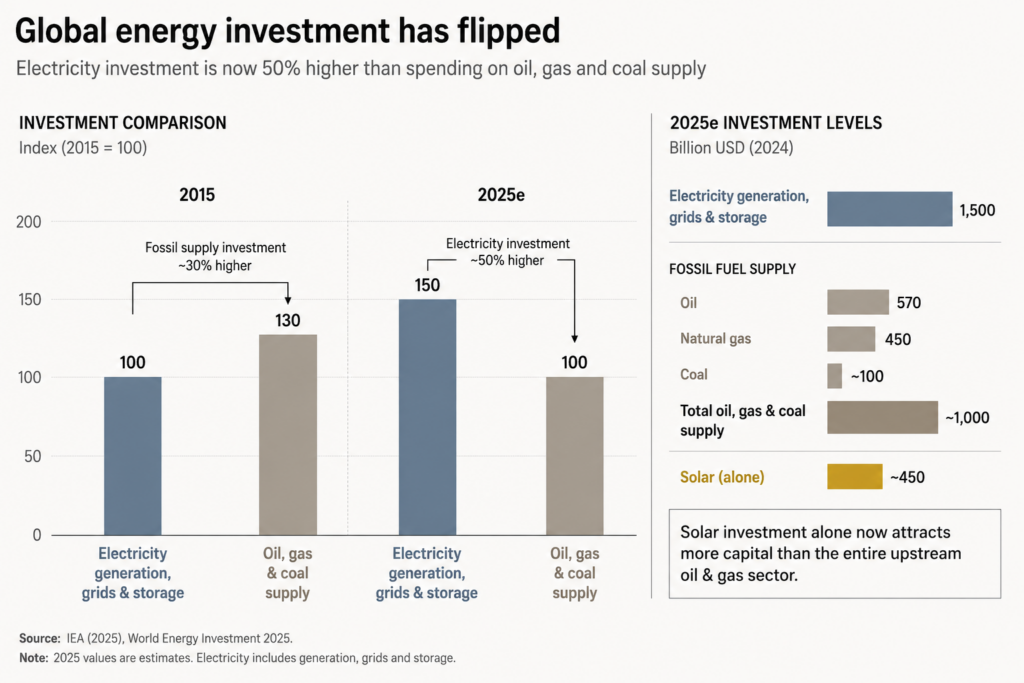
The International Energy Agency’s investment data clearly tells the story. A decade ago, fossil fuel investment exceeded spending on electricity generation, grids, and storage by roughly 30 percent. By 2025, the relationship had completely reversed. Electricity investment now runs roughly 50 percent above the combined total for oil, natural gas, and coal. Solar investment alone attracts more capital annually than the entire upstream oil and gas sector.
This shift did not occur because markets concluded fossil fuels were no longer necessary. It occurred because governments decided they should become less important. Subsidies, mandates, ESG pressure on institutional lenders, and regulatory hostility toward new fossil fuel infrastructure all pushed capital in the same direction.
Imagine a farmer told he may only plant one crop in the future — a promising new variety, but one not yet tested in every season or climate. At the same time, the grain silos storing the old harvest are quietly dismantled. If the new crop performs perfectly, the transition succeeds. But if the harvest disappoints, or arrives late, or fails during a drought, there is nowhere left to turn. The silos are gone. That precarity reflects the position of the modern energy system.
When governments distort the price signals that coordinate investment in capital-intensive industries, capital flows somewhere other than where it is most urgently needed. The consequences do not appear immediately. They accumulate slowly, in the form of deferred maintenance, abandoned projects, shrinking spare capacity, and reduced resilience. The system appears stable until a shock arrives that it can no longer absorb.
The IEA reports that nearly 90 percent of upstream oil and gas investment since 2019 has gone not toward expanding production but merely toward offsetting natural field decline. The industry is running faster to stand still, and doing so with a shrinking capital base. The supply pipeline for the late 2020s is being shaped right now, and the investment decisions of 2020 and 2021 have already made it thinner than the world can comfortably afford.
Exactly one technology is capable of generating reliable, large-scale, zero-carbon electricity regardless of weather, season, or time of day. It is not solar. It is not wind. Both are intermittent by nature. The technology is nuclear power, and the same regulatory culture that pushed fossil fuels out of the energy mix spent decades ensuring nuclear power could not replace them.
Between 1954 and 1978, the United States authorized the construction of 133 nuclear reactors. Since 1978, only two have entered commercial operation. The permitting and construction timeline for a new nuclear facility now frequently exceeds twenty years. Regulatory costs alone can reach tens of millions of dollars annually before a single kilowatt-hour is generated.
Nuclear power did not become uneconomic because consumers stopped wanting reliable electricity. It became uneconomic because regulators made it so — layer by layer, decade by decade, requirement by requirement — until the economics no longer worked. The same political impulse that declared fossil fuels incompatible with a sustainable future also prevented its only scalable replacement from being built on the necessary timeline and budget.
One critical miscalculation is at the centre of the present crisis: activists planned to move away from fossil fuels without ensuring a destination existed first. Part of the old capital structure was dismantled before the replacement was ready. In the gap between the two, the system’s resilience quietly disappeared.
Into this increasingly fragile system has arrived a demand shock few policymakers anticipated. Artificial intelligence and data centers are driving the fastest growth in global electricity demand in more than a decade. Large data centers consume as much electricity as small cities do, continuously and without interruption. This is precisely the kind of demand profile that reliable baseload generation was designed to meet — and precisely the kind that intermittent renewables cannot reliably satisfy alone.
It might sound like a degrowth conspiracy, but it’s simply structural pressure. Suppressing reliable baseload investment created a system with steadily shrinking resilience. The AI-driven surge in demand merely exposed the weakness. Had fossil fuel investment been allowed to follow market price signals toward market-supported expansion, and had nuclear power remained economically viable to construct, the system would likely have retained enough margin to absorb both rising demand and geopolitical disruption. Instead, the margin disappeared.
Grid infrastructure tells a similar story. Investment in transmission networks has lagged far behind investment in generation capacity. The infrastructure needed to connect newly generated supply to new areas of demand remains trapped inside the same permitting bottlenecks that crippled nuclear development. The same regulatory instinct that created the fragility is now obstructing market attempts to repair it.
Ludwig von Mises identified the central logic of interventionism long ago: one intervention creates distortions that appear to require additional interventions to correct, until the system itself becomes dependent on political management rather than economic coordination. The modern energy system has drifted deep into that logic. Fossil fuel investment was redirected politically. The resulting fragility was temporarily hidden by weak demand growth. Nuclear power, the natural corrective, was regulated into stagnation. The AI-driven surge in electricity removed the remaining slack. Then a geopolitical shock in the Strait of Hormuz exposed what years of distorted investment signals had quietly created.
Every barrel of oil above $100 is the energy system presenting the invoice for years of suppressed price signals and redirected capital allocation. The hundreds of billions of dollars in upstream investment that never materialized do not vanish harmlessly. They return later as supply shortages, higher prices, and reduced resilience — precisely when geopolitical instability removes the last remaining buffer.
A genuinely market-driven energy system would not have produced perfection. But it likely would have produced resilience. Absent intervention, price signals encourage additional baseload investment before shortages become acute. Capital flows toward nuclear generation before regulatory costs make construction prohibitively slow and expensive. The energy transition would have proceeded at the pace the underlying capital structure could realistically support.
The tanker captain still cannot sail his route. Consumers see the consequences in every electricity bill and every trip to the gas station. These are not merely the costs of a geopolitical crisis. They are the delayed costs of the policies that made the energy system unable to withstand one.
Jerome Powell’s term as Federal Reserve chair ended Friday, and assessments of his legacy are already rolling in.
At Bloomberg, Amara Omeokwe and Catarina Saraiva describe Powell as “The Fed Chair Who Fought Back.” At Forbes, Danielle Chemtobe says he “leaves behind a legacy of navigating inflation and defending the independence of the central bank under pressure from the president of the United States.” Greg Robb, at MarketWatch, says “Powell’s legacy as Fed chair is fighting inflation and Trump.” Jamie McGeever, at Reuters, describes him as the “Defender-in-Chief.” Squawk on the Street’s Sara Eisen recounts Powell’s legacy as “a champion for Fed independence, saving the world economy from a deep depression during the COVID shutdown, and fighting 41-year high inflation without wrecking the economy or jobs, achieving the rare soft landing.”
If these early accounts hold up, Powell will be remembered as a fighter — and a successful fighter, at that. He is widely believed to have protected the economy in the pandemic and shielded the Fed from political pressure. But his record, on both counts, is somewhat mixed.
Powell and the Pandemic
When the economy contracted in early 2020, Powell vowed to do whatever it would take to facilitate a speedy recovery. The Fed, under his leadership, moved quickly to increase the monetary base, cut the interest rate it paid on reserves, and open a host of emergency lending facilities. The Fed’s efforts, Powell told the Senate Banking Committee in May 2020, were intended “to facilitate more directly the flow of credit to households, businesses, and state and local governments” to prevent them from failing during the pandemic.
At least in hindsight, however, Powell’s Fed appears to have done too much.
As the economy reopened and real output recovered, the additional liquidity pushed prices higher. The Personal Consumption Expenditures Price Index, which is the Fed’s preferred measure of inflation, grew 13.9 percent from January 2020 to January 2023 — or, roughly 4.3 percent per year. The excess inflation left prices around 7.8 percent higher than they would have been had the Fed hit its two-percent inflation target over the period. The recovery was speedy. But the cost was higher inflation.
No doubt some will try to absolve Powell of the high inflation in 2021 and 2022. Many initially attributed the higher prices to pandemic-related supply disruptions and, later, Russia’s invasion of Ukraine. And some still believe constrained supplies — not Fed policy — are largely to blame.
As I explained at the time, however, temporary supply disruptions cannot account for the permanent rise in prices:
Temporary supply disturbances are temporary. The pandemic and corresponding restrictions reduced our ability to produce. But they will not reduce our ability to produce forever. The lifting of restrictions, vaccine rollout, and gradual acceptance that a mild version of the virus is endemic will eventually permit production to return to normal, even if it has not done so already. […] When production returns to normal, so too do prices. But that is not what the Fed is projecting. Instead, the Fed is projecting that prices will remain permanently elevated. Why would a temporary supply disturbance cause a permanent increase in the level of prices?
Production had mostly returned to its pre-pandemic growth path by 2021:Q3. But prices remained elevated. Indeed, they were growing more rapidly. The implication, as I said then and would repeat in the months that followed, was clear: much of the inflation — and certainly the lasting component — was demand-driven.
Although Powell initially thought inflation was supply-driven, he eventually came to accept that there was a demand-side problem, as well. He famously abandoned the term “transitory” in November 2021. And, as Bill Bergman and I have shown, the Federal Open Market Committee (FOMC) revised its statement in December 2021 to acknowledge “Supply and demand imbalances […] continued to contribute to elevated levels of inflation” (emphasis added). I think Powell — and others at the FOMC — should have recognized the demand-side problem by September 2021. But he did ultimately recognize it.
One might give Powell a pass for only belatedly seeing the demand-side problem and the corresponding need to tighten monetary policy. But should he get credit for bringing down inflation once the problem was understood?
Powell seems to think so. “We looked at the inflation as transitory,” he told journalists in January 2025. “And when the data turned against that in late [20]21, we changed our view, and we raised rates a lot. And here we are at 4.1 percent unemployment and inflation way down.” The Fed, in Powell’s telling, acted “quite vigorously […] once we decided that that’s what we should do.”
In fact, the Powell Fed was rather slow to tighten monetary policy even after it realized there was a demand-side problem.
Bryan Cutsinger and I have described the policy response:
Although the FOMC clearly acknowledged the increase in aggregate demand by December 2021, it did not immediately raise its policy rate. Instead, the FOMC began tapering its asset purchases and indicated it would likely begin raising its policy rate in March 2022. According to the December 2021 Summary of Economic Projections, the median FOMC member thought the midpoint of the federal funds rate would rise to 0.9 percent in 2022, consistent with a 0.75 to 1.0 percent target range.
[…]
To make matters worse, the FOMC was slow to revise the pace of its policy rate hikes once it realized the problem was much worse than it had previously thought. And it realized the problem was much worse pretty quickly.
The FOMC would begin raising its federal funds rate target in March 2022, as it had indicated it would. But the real federal funds rate remained negative through June 2022. “The Fed had eased off the accelerator,” we write, “but had not yet hit the brakes.”
Why didn’t the FOMC raise rates at its December 2021 or January 2022 meetings? Why did it only raise rates by 25 basis points in March? Why did it leave real rates negative through June 2022? Under Powell’s leadership, the FOMC was not merely late to recognize the demand-side problem. It was also slow to tighten monetary policy once the problem was realized.
Indeed, it is still trying to get inflation back down to 2 percent. Powell cites a “series of shocks,” including President Trump’s tariffs and the more recent conflict in the Middle East, for the lack of progress. But the problem now, as in late 2021, is excess nominal spending growth.
Powell and Political Pressure
Whereas some assessments of Powell’s legacy acknowledge his mixed record on inflation, the claim that he is a champion of central bank independence usually goes unchallenged. In March 2026, the American Society for Public Administration awarded him the Paul A. Volcker Public Integrity Award for “upholding a standard of faithful service impermeable to political pressure.” But here, too, Powell’s record is mixed: he allowed the Fed to drift into politically-charged areas and appears to have yielded to political pressure from the Biden administration.
Until very recently, Powell appears to have done little to abate the Fed’s mission creep into social justice topics. Louis Rouanet and Alex Salter document the “growing interest by Fed officials in ‘social justice’ topics, as opposed to topics strictly related to the goals set forth by Congress,” in the years just prior to the pandemic. Then, in 2020, the Fed revised its Statement on Longer-Run Goals and Monetary Policy Strategy to describe its employment objective as a “broad-based and inclusive goal,” which seemed to suggest the Fed was considering racial employment gaps. “While such gaps clearly exist,” Rouanet and Salter write,
they are structural: They persist regardless of short-run aggregate demand fluctuations. This means the Fed has adopted a goal that it cannot achieve without further embracing direct resource allocation, which is de facto fiscal policy, at the expense of liquidity provision. It also pulls the Fed further into the political arena by making central bankers allocators of scarce resources according to political, and perhaps partisan, criteria. Such actions are, at minimum, in tension with democratic governance.
The Fed dropped the phrase from its 2025 revision, despite Powell having explicitly affirmed it in prior years.
Powell also permitted the Fed to drift into climate policy. The Fed joined the Network of Central Banks and Supervisors for Greening the Financial System in 2020 and began pressuring banks to disclose climate risks and develop regulatory tools for climate stress testing thereafter. In 2023, Powell said the Fed has “narrow, but important, responsibilities regarding climate-related financial risks” and that the “public reasonably expects supervisors to require that banks understand, and appropriately manage, their material risks, including the financial risks of climate change.” The Fed withdrew from the Network of Central Banks and Supervisors for Greening the Financial System in 2025 — just three days before President Trump’s inauguration.
Regardless of what one thinks about social justice or climate policy, these topics clearly fall beyond the Fed’s mandate. Allowing the Fed to dabble in these politically-charged areas did not bolster its independence. It eroded it. And, although the Fed has since stepped back in both areas under Powell’s leadership, the damage to its independence has already been done.
Some have also claimed political factors are responsible for the delayed response to rising inflation in late 2021 and early 2022, as Gregg Robb reports:
Billionaire macro-trading legend Paul Tudor Jones suggested that Powell held off on raising interest rates — which were stuck close to zero for all of 2021 — because he wanted then-President Joe Biden to reappoint him. Biden was hoping a strong economy fueled by lower rates would help him get re-elected.
After Biden nominated Powell for a second term, ‘it was go time’ for rate hikes, Jones said in a podcast interview last month.
The timing is certainly curious. The Fed clearly acknowledged the demand-side problem in December 2021. But it did not raise its federal funds rate target until March 2022, and only by 25 basis points then. When the Fed raised its target by 50 basis points in May 2022, Powell said “a 75-basis-point increase is not something the Committee is actively considering.” Then he was confirmed and the tenor changed. The Fed raised its federal funds rate target by 75 basis points at each of the four meetings that followed Powell’s confirmation.
Further evidence that Powell relented to political pressure under the Biden administration comes from his visit to the White House in May 2022. While it is not unusual for a Fed chair to visit the White House, the meetings typically take place behind closed doors. They do not usually involve a press gaggle in the Oval Office. Many viewed the event as an opportunity for the president to “deflect blame back to the Fed” or “passing the buck” to the Fed chair ahead of the election, and Powell appeared to serve as a willing political tool.
Inflation, Independence, and Powell’s Legacy
There is no denying the difficulties the Fed has faced under Powell’s leadership, and he deserves credit for building consensus and instilling confidence in uncertain times. He has a remarkably cool demeanor and has managed to keep his cool despite ongoing pressure from politicians on both sides of the aisle. But one should not let affection for Powell — or, disaffection for President Trump — cloud one’s judgment.
A sober assessment of the actual decisions made and outcomes realized reveals a mixed record for Powell. His legacy is not great, but it could have been much worse.