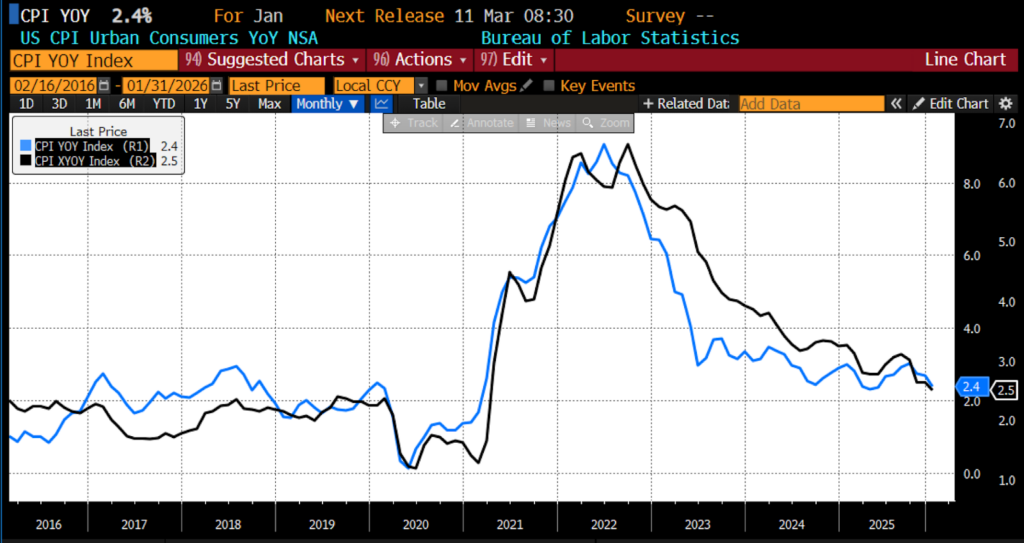
On Wednesday, the Federal Reserve lowered its federal funds target range by 25 basis points, to 3.75–4.0 percent, its second cut in as many meetings. The move came as no surprise to markets, which had largely anticipated another reduction despite inflation remaining stubbornly high. Two officials dissented in opposite directions: Governor Stephen Miran favored a larger 50-basis-point cut, while Kansas City Fed President Jeffrey Schmid preferred to hold rates steady.
At his post-meeting press conference, Fed Chair Jerome Powell reiterated that policymakers face challenges on both sides of the central bank’s dual mandate that calls for a “balanced approach.” Although the government shutdown has delayed the release of official labor market data, the available evidence suggests that hiring has slowed and conditions continue to soften even as inflation remains above the Fed’s two-percent target.
Still, Powell said economic activity is expanding at a moderate pace. Gross domestic product grew 1.6 percent in the first half of the year, but data released before the shutdown indicate that growth may be running somewhat stronger than expected, driven by resilient consumer spending and steady business investment. He cautioned that the shutdown will temporarily weigh on output but added that any drag should reverse once the government reopens.
Job gains, Powell noted, have slowed noticeably in recent months as labor-force growth weakens, reflecting lower immigration and participation. Labor demand has also softened, with both hiring and layoffs remaining low. Surveys show that households see fewer job opportunities and firms report less difficulty finding workers — both of which are signs of a cooling labor market. In short, he noted, “the downside risks to employment appear to have risen in recent months,” which is why the Fed decided “to take another step toward a more neutral policy stance.”
Powell acknowledged that inflation remains above the Fed’s two-percent goal. He said overall and core Personal Consumption Expenditures (PCE) inflation was running around 2.8 percent through September — slightly higher than earlier in the year — as goods prices have picked up while services inflation continues to ease. Short-term inflation expectations have risen this year, amid new tariffs, but longer-term expectations remain anchored near two percent.
Powell observed that “higher tariffs are pushing up prices in some categories of goods, resulting in higher overall inflation,” but described the effect as primarily a one-time increase in the price level rather than a lasting source of inflation. Even so, he warned that these cost pressures could persist longer than expected and said that the Fed would adjust policy if necessary to keep inflation under control.
The Fed now faces a “challenging situation” with “no risk-free path for policy,” Powell emphasized. Inflation risks remain tilted to the upside, while risks to employment have grown on the downside. Tightening policy too much could further weaken the labor market, but easing too quickly might reignite inflation pressures. Consistent with its framework, the Fed is taking what Powell called a balanced approach to managing both sides of its mandate. With the labor market softening, he said, the balance of risks has shifted, prompting the committee to take another step toward a more neutral policy stance.
The Fed, Powell added, remains well positioned to respond swiftly to new economic developments. Policymakers will continue to be guided by incoming data and the evolving balance of risks when setting the stance of monetary policy. The central bank still faces uncertainty on both sides of its mandate, and committee members hold sharply differing views about the path ahead. Powell stressed that policy is not on a preset course, and that “a further reduction in the policy rate at the December meeting is not a foregone conclusion — far from it.”
Alongside its rate cut, the Fed announced it will end the runoff of its balance sheet on December 1, concluding more than three years of quantitative tightening. Powell said the move reflects the Fed’s “long-stated plan…to stop balance sheet runoff when reserves are somewhat above the level we judge consistent with ample reserve conditions.” He pointed to tightening financial conditions in short-term funding markets. The decision, Powell noted, represents the “next phase of our normalization plans” that is designed to preserve stability rather than to signal a new policy direction.
The Fed’s latest moves reveal a central bank struggling to navigate competing risks with imperfect tools. The dual mandate practically requires monetary policymakers to treat rising prices and falling employment as opposing problems rather than considering the extent to which the movements in prices and employment are consistent with the underlying fundamentals. A nominal GDP target would collapse the false distinction between the two sides of the mandate, allowing the Fed to stabilize demand directly and let prices and employment adjust naturally. Such an approach would reduce the need for fine-tuning and spare policymakers from having to choose — again and again — between fighting inflation and protecting jobs.
Thirty years ago, Congress failed by just one vote to send to the states a constitutional amendment requiring a balanced budget. Today, federal debt held by the public stands at $29 trillion. As a percentage of the economy, it has doubled since 1996. When you add in other liabilities for federal employee pensions and health care, not even including the entitlement programs of Social Security and Medicare, the federal government’s liabilities extend to $45.5 trillion.
The federal government’s financial position is dire by any measure. Even adding assets (cash, inventory, loans receivable, and equipment, but not federal land) leaves them at a net worth of negative $40 trillion. Future Social Security and Medicare shortfalls for those already alive amount to over $65 trillion. So the unfunded future obligations of the federal government come to over $800,000 per US household.
A balanced budget amendment (BBA) would require Congress to stabilize the federal debt. Since Congress won’t voluntarily do it, it might be the only option to prevent massive tax increases and inflation within the next 30 years. But Congress repeatedly fails to take action. Why?
The main reason is that Democrats oppose it. The last time the House voted on a BBA, it won a majority, but not the two-thirds needed to advance a constitutional amendment. Democrats voted against it, 178 to six.
The Democrats might have been right to oppose it. The law would have required a balanced budget every year, unless Congress waived it by a three-fifths vote of each House or by a joint resolution that the provisions of the BBA would not apply during a military conflict. It also would have required a three-fifths vote to raise the debt ceiling.
Since there is no hope that Congress could manage to balance the budget in a single year (the just-closed fiscal year’s deficit is projected to have been $1.9 trillion), this amendment would have effectively required a bipartisan three-fifths vote to pass a budget every year. Sound familiar? As of this writing, Senate Democrats cannot agree with Republicans to pass a continuing resolution, which requires a three-fifths vote, and as a result, the government is shut down.
A better BBA would eliminate shutdowns and build in enough flexibility to make it unnecessary to override its provisions. Rep. Jodey Arrington’s 2024 resolution would have done some of this, but it never got a vote. It would have limited spending to the prior-three-year average of revenue plus population and inflation, built in a 10-year gradual closure of the deficit after ratification, and required a two-thirds vote for override.
Switzerland’s debt brake is an even better idea to adapt. It allows expenditures to equal no more than the revenues that would be expected from trend GDP. In other words, deficits are allowed during times of recession, and surpluses are expected during times of peak growth.
A flexible debt brake is more likely to be honored than a strict, every-year balanced budget rule. And one of the counterintuitive insights of rational-choice political science is that a higher-spending “reversion point” makes political actors less likely to vote for higher spending. For example, if we eliminated government shutdowns and simply legislated that whenever a budget fails to pass, the previous year’s budgeted expenditures would carry on, then defeating a budget would be a more tolerable option. The decisive voter in Congress would be less likely to acquiesce to high spending as the price to pay to avoid an intolerable shutdown.
Most Democrats are true believers in Keynesian aggregate demand management through fiscal policy. The debate among economists about the effectiveness of fiscal versus monetary policy goes on, but there is no need to resolve that debate for all time in the Constitution. A cyclically adjusted balanced budget amendment would address the concerns of the pro-fiscal stimulus camp while not foreclosing the possibility of even stricter fiscal rectitude if there is a congressional majority for it. Thus, a Swiss debt brake-type proposal could get the bipartisan support needed to advance a constitutional amendment.
It’s well past time for Congress to get serious about controlling runaway federal debt. A well-crafted, flexible balanced budget amendment to the US Constitution could finally get bipartisan support, end shutdowns, and set a hard limit on the federal government’s fiscal profligacy.
Electricity prices have moved from the background of daily life to the front lines of politics. What was once a quiet household expense is now a visible burden and a potent symbol of policy failure. Prices are rising not because of corporate greed or runaway markets, but because regulation, politically directed investment, and top-down energy planning have collided with the explosive growth of artificial intelligence. Inflation, supply constraints, and government mandates have turned the grid — once a model of steady reliability — into an arena where economics, technology, and politics now clash.
Americans once fixated on the price of eggs as the emblem of inflation. Now, the new shock comes in electricity bills. Power charges have jumped roughly 4.5 percent in the past year — nearly double the broader Consumer Price Index (CPI) — driven by surging demand from AI data centers and advanced manufacturing against a backdrop of limited supply. “When you have increased demand and limited supply, you’re going to pay more,” said Calvin Butler, CEO of Exelon Corp., which recently set aside $50 million to help low-income customers pay summer bills. The impact is spreading across the largest US grid, PJM Interconnection, where watchdogs estimate data-center growth alone has added $9.3 billion in power costs.
CPI Electricity SA, 2010 – present
(Source: Bloomberg Finance, LP)
The numbers confirm the squeeze. The Energy Information Administration reports that average US retail electricity prices in 2025 are about 13 percent higher than in 2022, with the typical household bill reaching $178 per month. In Virginia — home to the world’s densest cluster of data centers — residential power and transmission costs are expected to rise as much as 26 percent this decade and 41 percent in the next. Wholesale power in regions with aggressive climate targets, such as ISO-New England, has tripled since early 2024. The regulations meant to stabilize the transition are now amplifying volatility.
For two decades, data centers were small, fairly nondescript, warehouse-like structures on the landscape. The rise of generative AI has changed that. Training large language models demands vast computing power, transforming modest warehouses into mega-complexes that draw as much electricity as medium-sized cities and consume millions of gallons of water. Their footprint has turned electricity from a technical concern into an election issue.
In Virginia and New Jersey — this year’s gubernatorial battlegrounds — the politics of AI infrastructure have become a proxy for the nation’s energy debate. Virginia Democrat Abigail Spanberger argues that tech firms should pay a “fair share” for the grid upgrades their operations require. Her Republican opponent, Winsome Earle–Sears, blames clean-energy mandates for higher costs and reliability risks. In New Jersey, some proposals have sought to make data-center developers fund grid modernization, while Republican Jack Ciattarelli calls for more facilities and new gas plants to meet demand. Populist anger over rising bills has blurred party lines: even local candidates from both parties are now calling for moratoriums on new data centers.
US Department of Energy Retail Price of Electricity Sold to Residential Consumers, 2015 – present
(Source: Bloomberg Finance, LP)
States like New Jersey are seeing elevated and rising electricity prices after years of policy choices that prioritized offshore wind build-outs while allowing firm baseload and grid capacity to stagnate—most notably the 2018 shutdown of the Oyster Creek nuclear plant—even as demand accelerates. Now, the AI/data-center surge is colliding with those constraints: PJM projects roughly 32 GW of new peak load by 2030—~30 GW from data centers—creating “upward pricing pressure” and resource-adequacy concerns, and recent reporting shows consumers across PJM picking up billions in transmission costs tied to data-center growth. Offshore-wind obligations also carry above-market OREC costs that regulators and consultants note will be passed through to ratepayers, reinforcing price pressure where transmission upgrades lag. In short, places that retired nuclear and moved slowly on wires while leaning hard into offshore wind entered the data-center era underprepared, and are now struggling to keep up or raising rates to fund capacity and grid upgrades.
Frustration is spreading. In Missouri, Senator Josh Hawley has denounced “massive electricity hogs,” accusing Silicon Valley of pushing costly transmission projects that residential ratepayers subsidize. Georgia’s Public Service Commission race has revolved around claims that data-center operators enjoy five-cent kilowatt-hour rates while households pay four times more. These fights reflect an economic truth: fixed-rate industrial contracts and tax abatements merely shift costs onto consumers rather than reducing them.
Demand growth is not only remarkably strong, but rising and difficult to predict. The International Energy Agency expects global data-center power consumption to nearly double by 2030. But in a genuinely competitive market, such growth would attract private investment in new generation and transmission. Instead, multi-year permitting processes, domestic-content mandates, and litigation have throttled supply. Investor-owned utilities plan more than $1 trillion in capital projects through 2029 — much of it driven by regulation rather than market need — costs that inevitably flow into rate bases and monthly bills.
The political realignment around AI infrastructure reveals a deeper lesson: energy cannot be centrally planned without trade-offs. States like Texas, where competitive markets respond directly to price signals, deliver electricity at roughly half the price of Massachusetts and maintain stronger reliability despite rapid demand growth. By contrast, states that rely on administrative planning have locked in higher costs and slower innovation.
Average Retail Price of Residential Electricity, Massachusetts (blue) vs. Texas (white), 2015 – present
(Source: Bloomberg Finance, LP)
Both parties sense the stakes. The Trump administration’s AI Action Plan seeks to accelerate approvals and expand grid capacity to preserve US dominance over China, even as it moves to slow the retirement of fossil-fuel plants and roll back tax incentives for wind and solar. Democrats promoting the “abundance” agenda hail data centers as foundations of a digital and decarbonized future. Yet the economic tension is the same: who pays for the electrons that power the machines?
Electricity is no longer a neutral input; it is a commodity of both growth and grievance. The market could meet rising demand efficiently if freed to do so. Instead, bureaucratic control, subsidy races, and political favoritism have produced shortages that politics then exploits. The cure being offered — more mandates, more subsidies, more planning — is itself the disease.
A genuinely market-based approach would let prices reflect scarcity, open generation and retail supply to competition, and end cross-subsidies that hide costs from voters. Decarbonization and innovation can coexist with affordability, but only when capital is allowed to flow where returns justify the risks taken. As Americans open their power bills they are discovering, and in some cases rediscovering, that electricity is ultimately a market good, not a political entitlement, and that attempts to regulate away its costs only defer and magnify them.
When a sharply lower price per gallon pops up at local gasoline pumps, it can induce a momentary cognitive dissonance. I mean, where is inflation? During the first 10 months of President Donald Trump’s second term, the price of oil has slid markedly. It is now, in mid-October, around $57 per barrel, down from about $70 in late July — a drop of roughly 20 percent in three months. It is the lowest in almost five years: that is, since Trump ended his first term and Biden took over. What lies behind this decline? Has the administration’s “Drill, baby, drill” approach resupplied starved markets — or do global forces get some of the credit?
From day one, the second Trump administration moved to reverse climate-oriented policies and promote fossil-fuel production. On January 20, 2025, Trump signed executive orders lifting restrictions on oil and gas development in Alaska’s Arctic National Wildlife Refuge and expediting liquefied natural gas (LNG) infrastructure approvals. A companion order directed agencies to halt or review clean-energy initiatives and accelerate oil-and-gas permitting. Observers called the early rollbacks as sweeping as those of his first term, extending to federal-land leasing, emissions limits, and pipeline construction. Polling by Pew Research Center showed a partisan divide: 57 percent of Republicans favored expanded drilling on federal lands, compared with 9 percent of Democrats.
By contrast, the Biden administration (2021–2024) emphasized carbon reduction and tighter regulation of fossil-fuel production while subsidizing renewable energy and electric vehicles. Biden did not halt all drilling — the momentum of US output remained high — but his regulatory regime was more restrictive. The return to Trump represented a decisive pivot back to fossil-fuel liberalization. Experts caution that US policy alone cannot control prices in a global market. One Brookings Institution analyst stated the obvious: the United States is not the world. “Oil is priced internationally … US actions alone will not have such a large impact.”
Has the “Drill, baby, drill” attitude itself caused the price slide? Not yet, at least. The expected surge in rigs has not had time to materialize; Inside Climate News reported in July that “Trump promised a drilling boom. The new rigs haven’t …” Actual infrastructure responses always take time. And undeniably, oil prices reflect a global market. The International Energy Agency (IEA) estimates a worldwide surplus of some two million barrels per day so far in 2025, potentially rising to four million next year. The US Energy Information Administration (EIA) projects Brent crude averaging about $62 a barrel in late 2025 and $52 in 2026 as inventories build. Reuters summed it up on October 17: “Oil prices set for weekly loss … after the IEA forecast a growing glut and US–China trade tensions.”
But one pundit’s “glut” is another man’s return to freer-market production that brings down prices for consumers. When scarcity is politically engineered, abundance looks like loss of control. The term “glut” implies waste, but it signifies that producers are finally freer to meet demand without artificial ceilings. In industry terms, a “glut” means daily production exceeding demand by roughly one to two million barrels — a surplus sufficient to swell inventories and push futures into contango, but hardly a collapse. It is the market’s way of re-establishing balance once production is allowed to breathe again.
The international context underscores the point. OPEC and its allies (OPEC+) are raising output by roughly 1.4 million barrels per day this year. Exports from the Middle East reached two-and-a-half-year highs in September. Russia, despite sanctions and infrastructure risks, continues significant exports, while Venezuela, Libya, and Nigeria have added supply. China’s crude imports fell to their lowest level since January, reflecting weaker industrial demand and a pause in stockpiling. Altogether, rising supply and softening demand have pushed futures markets into contango — a classic signal of near-term oversupply.
For drivers, homeowners, and businesses dependent upon power supplies, cheaper oil is welcome; lower gasoline and heating costs boost disposable income and ease upward pressure on prices caused by huge Fed money supply increases. This is how markets are supposed to work: as competition expands, prices fall to the benefit of every consumer. What some pundits call “market pain” is simply the end of protected pricing. Producers don’t welcome lower prices, but for how long have we read about galloping profits of “Big Oil” as a side effect of the war on fossil fuels? The Wall Street Journal recently warned that “lower oil prices are severely affecting the domestic oil industry, which is already struggling with job losses and shrinking profits.” Even so, ExxonMobil, Chevron, and Shell are reporting profit margins still above their 2015–2019 averages — evidence of normalization, not collapse. Goldman Sachs expects prices to decline through 2026 because of excess supply and weak demand. Market analysts see the drop as signaling a broader economic slowdown linked to US–China trade tensions. Gulf stock markets have also softened on the weak oil price outlook.
And that amounts to what? For the four Biden years, competition in the oil industry was suppressed by attacks on fracking, restrictions on drilling permits, and the blocking of major supply pipelines — not to mention the moral denunciation of fossil fuels as planetary doom. When Washington throttled new leases and raised compliance costs, small independents were forced out. What survived were the giants, protected by scale and legal muscle — and applauded as “responsible corporate citizens.” Now, in America at least, competition is unleashed again, price competition is back, and “Big Oil” profits are reverting to market norms. As Shale Magazine editor Ronald Rapier said, “It’s an irony that when Democrats are in there and they’re putting in policies to shift away from oil and gas, which causes the price to go up, that is more profitable for the oil and gas industry.” Ironic that suppressing supply drives up prices so existing companies profit?
Environmentalist voices, unsurprisingly, are raising alarms of a different kind. PBS reported that market forces (rising prices) could undercut the administration’s plans to increase the use of fossil fuels, but Trump plans to roll back climate regulations, end clean-energy incentives, and promote fossil fuels. Climate-policy groups condemn the agenda as “a dream for polluters and a nightmare for America.” Cheaper fuel may slow investment in renewables and electric vehicles, reducing momentum toward emissions targets.
And that is where we are just 10 months into Trump’s second term. His policies reinforce a pro-fossil-fuel trend that is increasing US supply and could continue over time. It is early days, so the administration’s commitment is consistent with lower prices, but not yet the dominant cause. There is speculation that a $60 per barrel price, slightly higher than now, might represent current market equilibrium. Should oil fall below $60 for long, some producers may curtail output — the CEO of TotalEnergies has already warned that non-OPEC supply would decline at that threshold.
Energy abundance, however, is not an anomaly. It happens when government stops treating energy as a sin. Trump’s policy did not “distort” the market; it let the market remember what freedom feels like. Consumers enjoy cheaper fuel, producers face genuine competition (but fewer accusations of “obscene profits”), and environmentalists, as ever, lament lost momentum.
It must be added that if this is good news, it is not all good. Free market policies are doing their job, but the Trump tariffs are not free market and are a headwind. The Federal Reserve Bank of Dallas’s quarterly survey of oil and gas producers reported that one-third of respondents thought that higher tariffs on steel imports might result in drilling fewer wells. And three-fourth said tariffs raised the cost of drilling and completing new wells.
Mr. Trump is not notable for articulating consistent principles and clear policies. As long as that is the case, results will be mixed and the case for free-market measures will be vulnerable to a confusion of the benefits of partial economic freedom with the damage from continued partial controls. Such confusion always advantages the side with the weakest arguments.
Once upon a midnight dreary, while I pondered, weak and weary, Over many a quaint and curious chart of fiscal lore — While I nodded, nearly napping, suddenly there came a tapping, As of markets softly rapping, rapping at my ledger’s door. “’Tis the Fed,” I muttered, “tapping at my nation’s door — Only MMT, nothing more.”
Modern Monetary Theory (MMT) emerged like a laboratory experiment equal in ambition and madness. MMT is the idea that governments and central banks can print money and flood the economy with their respective currency without consequences, as long as the velocity of cash in circulation remains under control. In 2019, the theory had begun to seep into the political mainstream as a means to pay for large government expenditures, such as The Green New Deal, by potential 2028 presidential candidate Alexandria Ocasio-Cortez.
The brainchild of Stephanie Kelton, advisor to the Bernie Sanders 2016 presidential campaign, MMT underlines the idea that, unlike a household, the government can disregard its budget entirely. In a TED Talk on October 21, 2021, Kelton stated, “The federal government is fundamentally different, unlike the rest of us, Congress never has to check the balance in its bank account to figure out whether; it can afford to spend more. As the issuer of the currency, the federal government can never run out of money, it can afford to buy whatever is available and for sale in its own currency.”
During the onset of government lockdowns prohibiting commerce and the pursuit of happiness, MMT saw the light of day. From spring 2020 to winter 2021, the federal government dispersed $931 billion directly to individuals in the form of stimulus checks found under the CARES Act of 2020 and the American Rescue Plan of 2021. This sum far outweighs the stimulus payments of the 2008 banking crisis ($108 billion) and the 2001 Dot-com Bubble ($36 billion). The Mises Institute reports the Federal Reserve’s balance sheet more than doubled between 2020 and 2022, from $4 trillion to $9 trillion. Within two years, the money supply measured as M2 grew roughly 40 percent. In retrospect from 2000 to 2019, the money supply grew annually by six percent. The scale of that monetary experiment, printing dollars into a politically frozen economy remains an unprecedented act of monetary expansion.
Like the phrase, “two weeks to flatten the curve,” the new economic catchphrase in circulation was “transitory inflation.” Just like the political phrase, the economic term “transitory inflation” was anything but short. The government was aware that increasing the money supply would consequentially increase inflation; however this would pass, and the average American need not worry. By 2021, then–Secretary for the Department of Treasury, Janet Yellen stated, “I really doubt we’re going to see an inflationary cycle, although I will say that all the economists in the administration are watching that very closely.” Just a year later, in 2022, the inflation rate peaked at nine percent. In 2024, researchers at MIT discovered that, “42 percent of inflation could be attributed to government spending.”
By its own doctrine, the Federal Reserve claims a dual mandate: “ two goals of price stability and maximum sustainable employment.” Price stability is measured yearly by the Price Index for Personal Consumption Expenditures and should not drastically exceed the bounds of two percent. As of August 2025, inflation remains at 2.9 percent following a steady trend of roughly two years during which inflation has hovered around three percent. In other words, everything has become more expensive since the cash injections from 2020. Doubt is rising as to whether the Federal Reserve will even defend its once sacred two percent target, given the late dominance of three percent.
The fiscal burden incurred within the last five years has not ended. Consumers struggle to read their economic landscape, muddled by the government and Fed alike. The Consumer Sentiment Index which ranges from 0 to 200, recorded on October 3, sits at 55. Since the beginning of the year, the dollar has decreased in value by 11 percent and could lose another 10 percent by 2026. Over the past three years, the dollar has lost nearly half of its purchasing power relative to gold and 8.4 percent when compared to goods and services. Speaking of gold, the precious metal has been hitting record highs of over $4000 per ounce, roughly a 33-percent increase since last year. Not alone in the climb, Bitcoin has risen from its 2020 value of under $10,000 to over $100,000. All that stimulus money has been moved away from dollars and into alternatives such as gold or Bitcoin.
The fundamental flaw of Modern Monetary Theory reminds us that money is a tool and prices are signals. Currencies are chosen not because the government deems them valuable, but because people place value in them. The chaotic years since 2020 have shown a depreciating currency as a consequence of devaluing the dollar. The resonating inflation, a tax without legislation, has not been transitory, but has perhaps redefined the standard of the Federal Reserve. Five years later, the experiment’s echoes remain in higher prices, fragile confidence, and a central bank trapped between denial and political dependence. MMT promised prosperity without pain, yet it left Americans haunted by the creature it awakened in 2020. The true monster was never the money itself, but the belief that we could summon and command it without consequence.
Fresh out of university and looking for a career in public policy, I interviewed for a job in the Conservative Research Department of the British Conservative Party. At the time, Margaret Thatcher, the Prime Minister, was concerned about the prevalence of soccer hooliganism and had proposed a national identity card scheme for soccer fans as a way of curtailing the problem. I was asked to provide arguments to justify this intrusion. I could not and sputtered a half-hearted response. I did not get the job (nor did Michael Gove, future Cabinet Minister and current editor of The Spectator, but a chap named David Cameron did). It soon appeared that the rest of the Conservative Party and the public at large agreed with me. The identity scheme faltered and was withdrawn from consideration.
Today, however, the British public is told that every one of them – football supporter or not – is to have a “BritCard” identity app on their phone. This would be a constitutional innovation of the worst sort, fundamentally altering the relationship between the citizen and the state, upending the traditional British concept of rights, and will probably pave the way for a complementary abrogation of liberty, a central bank digital currency (CBDC.) It is pretty much commonplace in the United Kingdom today to say that “Britain is finished,” but if His Majesty’s Government gets away with this, that may finally be right.
Aside from Thatcher’s flirtation, ID cards have a troubled history in the UK. They were introduced during the Second World War but were retained afterwards by the socialist Attlee government. By 1950, there was growing disquiet that the police were demanding to see ID cards during any routine stop. Things came to a head when a Liberal Party activist named Harry Willcock was stopped for speeding in North London. On being asked to produce his card, Willcock refused, responding with British understatement, “I am a Liberal, and I am against this sort of thing.” He further refused to produce his card at a police station and was therefore prosecuted under the wartime act.
The case was initially heard by local justices, who disagreed with Willcock that the law had expired as the emergency had expired, but refused to punish him, giving him an “absolute discharge.” The case proceeded to the King’s Bench division of the High Court to decide the point of law over whether the law was still valid and was unusually heard before a bench of seven judges, including the Lord Chief Justice, Lord Goddard. While the Court found that the law remained in effect, no costs were awarded against Willcock, which is usually the case in such circumstances, and Lord Goddard wrote the following:
“To use Acts of Parliament passed for particular purposes in wartime when the war is a thing of the past—except for the technicality that a state of war exists—tends to turn law-abiding subjects into lawbreakers, which is a most undesirable state of affairs. Further, in this country we have always prided ourselves on the good feeling that exists between the police and the public, and such action tends to make the people resentful of the acts of the police, and inclines them to obstruct the police instead of assisting them.”
Lord Goddard’s first warning does not just apply to wartime laws, but to any state of emergency – something I have discussed here before in another context. Emergency powers can easily turn the otherwise law-abiding into lawbreakers. However, the current Labour government is not claiming wartime powers or even a particular state of emergency, but to change the law in perpetuity.
That makes Goddard’s second warning the more pertinent. It has always been the case that British police have their authority through the consent of the public. As Sir Robert Peel’s principles put it, “the police are the public and the public are the police.” Police officers are simply members of the public “paid to give full-time attention to duties which are incumbent on every citizen in the interests of community welfare and existence.” The basis of policing is therefore mutual trust.
Mandatory ID changes that relationship. Trust is eroded when verification is required. Citizens are no longer partners in maintaining order but potential suspects. This is especially the case when the lack of ID itself becomes a crime, or at least an enforcement action. The message is that citizens are not the state but subservient to it, a message that should repel any freedom-loving people.
This was indeed the reason for the breakdown of the post-war ID mandate. Willcock went on to champion abolition within the Liberal Party, but as he was part of the out-of-favor free trade wing of the party, he made little headway (how history rhymes!), leaving the door open to the Conservatives, who campaigned on “setting the people free” against the Labour government that wished to retain it, and won. Willcock, who became a personal hero of mine as I researched this essay, died suddenly shortly after the repeal bill was passed, with the last word on his lips reportedly being, “Freedom.”
As I said, Thatcher’s flirtation with cards for football supporters that doomed my job prospects didn’t last much longer, and isn’t even mentioned in her memoir, The Downing Street Years. So, it was left to a Labour government under Tony Blair to try again. This time, a law entitled the Identity Cards Act of 2006 established a National Identity Register that would enable the issuing of ID cards. The government set about compiling the register, which included details like name, gender, date of birth, address, previous addresses, legal status for residency and so on.
The law was initially popular, reaching 80 percent public support, but enough people were incensed by the law for a mass pressure group to form called No2ID, campaigning against what it called “the database state.” This was backed up by academic research at the London School of Economics, which disputed the government’s rationales for the move, such as a rising threat of identity theft and international obligations, neither of which were found to have much weight.
No2ID’s campaign director said, “Our strategy was simple: To reach and engage those people who would rather go to prison than have an ID card…In reaching those people, we knew we’d get many more who were less committed, and educate millions. And if we got even just a handful of them, we’d be a force to reckon with.” They were indeed. It was the first act of the newly elected coalition Conservative-Liberal Democrat government in 2010 to repeal the Act.
Yet bad ideas never die (see also: socialism.) The current Labour government of Sir Keir Starmer has seized on current dissatisfaction with high levels of immigration to launch his bid for Digital IDs. This misses the target. Unlike in the USA, most popular discontent is not with illegal immigration, but with legal immigration – specifically the high rates of asylum seekers and those who came legally during the so-called “Boriswave” after Brexit.
Moreover, the real concern of those who oppose the scheme is not so much what the initial justification is but the likely mission creep. As suggested above, the introduction of mandatory ID cards fundamentally alters the relationship between the citizen and the state. The state becomes the gatekeeper of functions rather than their guarantor – and the number of functions likely to be affected is immense: welfare, banking, travel, medical records and services, even voting. Leviathan turns out not to be a Lovecraftian monster from the deep, but something made up of ones and zeroes.
The most likely next step is perhaps the most pernicious. Digital ID becomes the obverse side of digital currency. The Bank of England has already floated the idea of a programmable digital pound, where programmability means the ability not just to monitor but to stop purchases. Given that regulations aimed at reducing childhood obesity have already led pubs and shops to stop offering free refills of hot chocolate, among other sugary drinks, it is easy to see how regulators would jump at the chance to use Digital IDs and currency to prevent purchases they disapprove of. Britain’s nanny state could make China’s social credit scheme look junior league by comparison. Thus, the introduction of Digital ID cards may be the most important constitutional question the UK has faced in generations, more important perhaps than Brexit. No2ID no longer has a presence even on the web. If it cannot be reorganized, then Britain’s reputation as the home of a freedom-loving people may forever be lost. It is only a short step from “Papers please” to “Computer says no.”
Austerity comes from the Greek word “austeros,” connoting harsh, bitter, astringency. The first instance of the word to mean fiscal discipline was in 1937, when John Maynard Keynes admonished a fretful President Roosevelt that “the boom, not the slump, is the right time for austerity at the Treasury.”
That view appears to have changed slightly, in the sense that now austerity, even during “the boom,” is suspect. Paul Krugman said, “Slashing government spending destroys jobs and causes the economy to shrink”; Joseph Stiglitz warned that austerity “doesn’t work; it does not lead to more efficient, faster growing economies.”
In an excellent recent book, What Went Wrong with Capitalism?, Ruchir Sharma notes that the standard narrative describing neoliberalism is the systematic “gutting” of government programs, and the imposition of “austerity.” But Sharma goes on to note that the important question is not whether austerity “works,” but whether it even happened.
Sharma is right to ask. With apologies to Musa al-Gharbi, we have never been austere.
US Government Spending, Examined
The complaints of those who decry “neoliberal austerity” center on cutbacks in government spending. A “cut,” to be clear, is when the government spends less in year t+1 than it spent in year t.
Now, it is fair to evaluate such claims on their merits and ask whether cutting back on government spending would be harmful, or might even be beneficial. My purpose here is simpler: I am going to evaluate the empirical claim that government spending has been (I found published examples of all these) slashed, starved, decimated, hollowed out, stripped down, or rolled back.
The US is a federal system, meaning that there are overlapping jurisdictions that have different systems for raising and spending money. So “government spending” is actually separable into two parts: federal, and state/local. I am going to evaluate the claims about austerity by looking at the level of government spending over time.
There are many places to start, but I chose 1960. In that year, the federal government spent $77 billion; in 2025 the amount will be close to $7 trillion. But those are “nominal” or current dollars, and it is misleading to label inflation increases as spending increases. In fact, the austerists might even have a point: if spending rose, but by less than the rate of inflation, that would effectively be a spending cut, in terms of what the money will buy. So I have depicted government spending, both federal (orange line) and state/local (blue line), in constant 2020 dollars.
Figure 1: Federal Government Total Expenditures: St Louis Fed. W019RC1A027NBEA
Obviously, controlling for inflation produces no evidence of any kind of cutbacks, or for that matter, a slowdown in growth, for government spending.
Two eras are worth particular note: The Reagan era (1981-1989) and the Obama era (2009-2017). If you took away the horizontal axis and asked someone to pick out the time of the notorious “Reagan government spending cutbacks,” they would certainly not choose the actual Reagan era. There was no cutback in spending under Reagan, at least at the federal level, where the cuts were supposedly so dramatic. And even at the state/local level, the “cuts” were simply a pause in growth, not a reduction.
The Obama era, at least after the financial crisis, did see a pause in spending increases. But remember, these data are controlled for inflation, and for population. There were actually sharp increases in the dollar amounts budgeted; the increases were just less than the trend everywhere else. There are no cuts, never, not anywhere in the whole picture, until the “cuts” resulting from the expiration of the temporary “Carnival of COVID Spending” in 2022.
But (an austerist might object) the population has increased. The true measure of budget cutbacks must account for spending per capita!
I once accepted this argument as valid, but my friend Kevin Grier pointed out to me that it is bizarre. After all, economists usually argue that governments supply public goods, or create a regulatory framework in which other market failures can be corrected. But these activities, by definition, require what economists call “non-rival” consumption. In English, that means that adding more “consumers” does not change the cost of provision of the service. National defense, the “canonical” (get it? Canon?) public good, is entirely independent of the number of people in a given state, or in the country. Defending the territory of the US has nothing to do with the number of people living there. Revenue and tax income can depend on population, but there is no obvious reason why spending has to be “controlled” for population.
Nonetheless, let’s do this. Figure 2 depicts the history of government spending per capita, 1960–2022, in constant 2020 dollars.
Figure 2: State and local government total expenditures, in 2020 dollars. St. Louis Fed. W079RC1A027NBEA (FRED data)
The same basic pattern, of constant increase, is clear. There is absolutely no evidence (none!) of a spending cut, or even a change in the rate of growth, at any point in the supposedly draconian “neoliberal” Reagan-Bush years.
One can imagine the austerist thinking hard now, desperate to save their pet theory of economics, which requires that neoliberalism caused austerity. “AHA! I’ve got it!” our austerist says. “GDP! You have to normalize government spending as a proportion of GDP! Government must have shrunk by that measure!”
To find out, consider Table 1: a set of stacked bar charts for 1960, 1990, and 2020. The sections of each bar are the percentages of GDP made up of federal, and state/local, government spending.
Figure 3: Population B230RC0A052NBEA and per capita GDP (FRED data)
Clearly, this measure — which, because it is a percentage at a point in time, also controls for both population and inflation — shows the biggest increase of all. Total government spending was only 30 percent of GDP in 1960, but it is 40 percent (and growing) today.
Now, there are some arguments that government spending of any type doesn’t belong in GDP in the first place. But let’s put that to one side. Government spending has increased, sharply and consistently, for the entire period that is usually labeled as “neoliberal austerity” by critics. That’s true even if you control for inflation, and population growth, and consider spending as a proportion of GDP.
We have never been austere. So why do we hear so much about “austerity”?
Austerity as Sleight of Hand
In fairness, there have certainly been advocates for something like real austerity throughout some of the great economic disruptions of American history. In his autobiography, Herbert Hoover famously quoted Andrew Mellon, then Treasury Secretary, in November 1929 (immediately after the Crash, in October) this way:
[T]he ‘leave it alone liquidationists’ headed by Secretary of the Treasury Mellon, …felt that government must keep its hands off and let the slump liquidate itself. Mr. Mellon had only one formula: ‘”‘Liquidate labor, liquidate stocks, liquidate the farmers, liquidate real estate.’”‘ He insisted that, when the people get an inflation brainstorm, the only way to get it out of their blood is to let it collapse. He held that even a panic was not altogether a bad thing. He said: ‘It will purge the rottenness out of the system. High costs of living and high living will come down. People will work harder, live a more moral life. Values will be adjusted, and enterprising people will pick up the wrecks from less competent people.’
Hoover not only ignored this advice but introduced a flurry of behind-the-scenes spending (as documented by Amity Shlaes) to try to stimulate the economy. Still, because Mellon was the public face of the administration, there is a perception that austerity was tried. It wasn’t.
What is interesting is that the very definition of austerity was changed so that it became possible to point at actual examples. The sleight of hand, which has been noted but not fully understood, is that “austerity” was changed from meaning “cutting the level of government spending” to its current meaning: “cutting the growth in government spending.”
In 1981, there was a famous article in The Atlantic entitled “The Education of David Stockman.” The most important part of that “education” was Stockman having to face the hard truth that a “spending cut” is not reduced spending. It is a reduction in the amount by which spending will be increased in the future. So, if we are scheduled to increase government spending by 10 percent, and we only increase spending by six percent, that is a four percent cut. This question of the definition of a “cut” was central to Congressional politics in the 1990s. In 2011, Stockman noted (correctly) that the supposed $38 billion in “reductions” in the Obama budget were actually a substantial increase.
But no one paid attention. The “austerity” story was too important for the standard narrative of the left. Mike Konczal wrote in Dissent magazine, on January 19, 2017, that “Austerity, both as a practice and as a metaphor, defined the landscape, culture, and politics of the Obama era.” In fact, as we saw in Figures 1 and 2, spending increased substantially between 2009 and 2017, both in real terms and per capita. Politicians made a big show of cutting some of the proposed increases from budgets in 2011, 2012, and 2013, and that version of events has become the widespread perception.
My point is more than simple pedantry. While it is annoying to hear the false “austerity narrative” constantly repeated as Progressive gospel, the real problem is the policy implication. If we permit the “austerity cuts caused poverty, we need to spend more!” fable to become the stylized fact on which policy is based, we will not only be thinking of the wrong solution, but we’ll be working from a false history.
The howls of disapproval from the cowboy-hat demographic have been loud this week, and for good reason. President Trump has announced plans to quadruple the import quota of Argentine beef to “bring beef prices down” at the grocery aisle. It was accompanied by a characteristically Trumpian broadside on Truth Social:
“The Cattle Ranchers, who I love, don’t understand that the only reason they are doing so well, for the first time in decades, is because I put Tariffs on cattle coming into the United States,” Trump said on Truth Social on Wednesday. “If it weren’t for me, they would be doing just as they’ve done for the past 20 years — Terrible! It would be nice if they would understand that, but they also have to get their prices down, because the consumer is a very big factor in my thinking, also!”
In a single post he managed to both praise and insult the very people who embody the mythos of American self-reliance. You don’t talk down to cowmen — as a rule they’re damn sensitive to being told their fortunes hinge on the beneficence of a politician. As an example of the pitfalls of dabbling in command economics, you can’t conjure a better case study.
Ranchers are no fools — they know that prosperity in a tenuous sector doesn’t come from tariffs, subsidies, or decrees. It comes from hard work and resilient management in the face of fickle weather and shifting markets. When a big-city billionaire — even one they’ve largely endorsed — tells them “you’re doing well because of me,” the reflexive response is basically what I heard from a cowboy buddy in Arizona: “Gaslight us harder, Mr. President.”
Trump is right: cattle prices have been astonishingly high the past few seasons, for a variety of extremely complicated factors mostly having to do with the size of the national cow herd. But Trump is laughably off base to attribute the recent high prices to his tariffs, which to the extent they had any effect at all, were applied long after the rise in cattle prices.
Trump’s maneuvering reflects the deepest problems of a command economy — you simply can’t foresee the knock-on effects of various market manipulations. Once you start tinkering — raising tariffs to curry favor with domestic producers, then slashing them to win over consumers, or allocating tariff revenues to those who are harmed by the tariffs — you trap yourself in the same contradictory logic that doomed the old Soviet planners. Every knob you twist sends vibrations through a market ecosystem too vastly complex to predict.
Take beef, which is a deceptively “simple” product. It isn’t. Its price is the result of feedlot margins, grazing leases, rail freight rates, hide buyer availability, veterinarian fees, hay producer margins, and farm credit, and a kaleidoscope of other factors. Like many industries, it is also heavily influenced by government regulations, including tariffs. Price signals ripple through this vast and interconnected network like nerve signals in a living body. Interference with one aspect risks numbing the whole. Beef, as a product of the modern integrated global market is no more “simple” than a semiconductor, and managing its price is a fool’s errand.
Ranchers can no more unilaterally “get their prices down” than they could unilaterally get their prices up over the 20 years when they were doing “Terrible.” Cow-calf producers (the foundational unit of the beef complex) take 400-600 pound calves to sale and pretty much take whatever price is being offered by the “buyers” (usually background/stocker/feedlot representatives). Those prices have, for decades, been marginal at best and were often lower than the input costs. In the absence of a vigorous small-scale meat processing complex (regulated largely out of existence), the options were limited. That has changed recently with the higher prices that come with lower inventories, and many ranchers are regaining some solvency lost over preceding years, but they all know it’s out of their control. Like the rain, they take it when they can get it.
Still, ranchers are right to feel whiplash. One day, they’re told tariffs are patriotic; the next day, they’re scolded for high prices. They are pawns in a political game that treats them alternately as mascots and villains. The message from Washington — sometimes in the same sentence — is: We love you, but you’re doing it wrong. This is the cultural insult buried at the heart of Trump’s missive. Rural America has long sensed that its independence is something to be managed, not respected. Trump insists that cowmen owe their good fortune to his tariff policy, but by doing so he adopts the same paternalism that ranchers despise in bureaucrats from either party. Whether the diktat comes from a Manhattan boardroom or the White House, it still smells like the city: clueless and smug, all at the same time.
The kind of economic nationalism Trump has unleashed pretends to restore dignity to the producers and manufacturers forgotten by globalization. But true dignity never comes from protection — it comes from freedom. Give ranchers open access to world markets, stable rules, reduced regulations, and the assurance that government won’t yank the reins every election cycle, and they’ll take care of the rest. The West was not won on quota systems.
What’s galling about this latest announcement isn’t just the inconsistency; it’s the presumption that prosperity can be engineered by presidential decree. Beef markets, like any living system, balance themselves through millions of daily decisions — when to calve, when to sell, when (or if) to buy feed, when to hold back heifers. That’s the invisible hand at work, and it’s far smarter than any White House staffer with a spreadsheet.
Politicians often say they “love” the rancher, the farmer, the working man. But love, in economics as in life, is best revealed by respectful restraint. Don’t interfere. Don’t pretend to know better. Don’t weaponize one group against another in the name of populist sympathy. Ronald Reagan, the cowboy president, said the nine most terrifying words one could hear was “I’m from the government and I’m here to help.” As the cattle industry turns its back on Trump’s meddling, he is about to learn the political perils of a command economy as well. The best thing Washington could do for the beef industry is to stop helping it.
Medicaid, Title XIX of the Social Security Act, is a joint federal-state program that finances health care to the poor.[1] When it was first signed into law, Medicaid eligibility was limited to low-income children, pregnant women, parents of dependent children, the elderly, and people with disabilities. In the sixty years since the program was enacted, however, it has strayed from its mission of providing healthcare for the most vulnerable and has become a steppingstone toward universal government-run health insurance.
This explainer will outline how Medicaid functions, the program’s costs, its influence on healthcare in the United States, and how the proposed policy changes in 2025 could reshape the program.
How Does Medicaid Work?
Medicaid is divided into two groups: traditional Medicaid and the Medicaid Expansion group. Before discussing the differences between the two, it’s important to understand that there are strings attached. For a state to participate in Medicaid (either traditional or expansion), the federal government requires that state to provide Medicaid coverage for certain eligibility groups, including[2]:
Certain low-income families, including parents, that meet the financial requirements of the former Aid to Families with Dependent Children (AFDC) cash assistance program;
Pregnant women with annual income at or below 133% of the Federal Poverty Level (FPL);
Children with family income at or below 133% of FP;
Aged, blind, or disabled individuals who receive cash assistance under the Supplemental Security Income (SSI) program;
Children receiving foster care, adoption assistance, or kinship guardianship assistance under the Social Security Act (SSA) Title IV–E;
Certain former foster care youth;
Individuals eligible for the Qualified Medicare Beneficiary program; and
Certain groups of legal permanent resident immigrants.
Federal law provides two primary benefit packages for state Medicaid programs: traditional benefits and alternative benefit plans (ABPs). These benefit categories (taken from the Congressional Research Service) are recreated in Table 1. States also have some flexibility through Medicaid program waivers, which allow them to be exempt from certain federal requirements. These include research and demonstration projects (Section 1115), managed care/freedom of choice programs (Section 1915(b)), and home and community-based services (Section 1915(c)). To receive a waiver, a state must meet federal financing requirements such as budget neutrality, cost-effectiveness, or cost-neutrality.[3]
It is also important to note that Medicaid spending is often lumped in with the Children’s Health Insurance Program (CHIP) and similar federal subsidies created under the Patient Protection and Affordable Care Act (Affordable Care Act or ACA). The CHIP program provides health coverage to eligible children in families with incomes above the Medicaid threshold, either through Medicaid or separate state programs. The federal subsidies created under the ACA include premium tax credits (which subsidize the cost of an insurance premium) and cost-sharing reductions (reducing out-of-pocket costs such as deductibles, copays, and coinsurance) for those who purchase health insurance through a government-created healthcare marketplace.
Traditional Medicaid
Traditional Medicaid covers both primary and acute care as well as long-term services and supports (such as care for disabled adults and individuals with chronic illnesses). Eligibility is limited to low-income children, pregnant women, parents of dependent children, the elderly, and people with disabilities. In this program, states are guaranteed federal matching dollars without a cap for qualified services, based on a formula that matches at least 50 percent of state spending. The portion of the federal government’s share of most Medicaid expenditures is known as the Federal Medical Assistance Percentage (FMAP). This matching rate increases as state per-capita income decreases.
Under traditional Medicaid, states define the specific features of each covered benefit within four broad federal guidelines:
Each service must be sufficient inamount, duration, and scope to reasonably achieve its purpose. States may place appropriate limits on a service based on such criteria as medical necessity.
Within a state, services available to the various population groups must be equal in amount, duration, and scope (the comparability rule).
With certain exceptions, the amount, duration, and scope of benefits must be the same statewide (the statewideness rule).
With certain exceptions, enrollees must have freedom of choice among health care providers.[4]
Looking ahead to FY 2026 (October 1, 2025 – September 30, 2026), the federal matching rates for state funds are expected to range from 50 percent (the mandatory minimum matching rate) to nearly 77 percent.[5] Figure 1 shows the federal Medicaid FMAP matching rate for each state.
Figure 1: Federal FMAP Percentages, FY 2026
Sources: KFF estimates of increased FY 2026 FMAPs based on Federal Register, November 29, 2024 (Vol 89, No. 230), pp 94742-94746.
Note: Estimates are rounded to the nearest whole number.
The Medicaid Expansion Group
Under the Affordable Care Act (ACA), states had the option to expand Medicaid to non-elderly adults with income up to 133 percent of the Federal Poverty Level. When states were initially allowed to expand Medicaid starting January 1, 2014, the federal government promised to cover 100 percent of Medicaid expansion costs to encourage states to participate. With this promise of a “free lunch,” many states rushed to expand Medicaid, sharply increasing enrollment. By 2020, however, the federal match rate for the expansion program was reduced to 90 percent. As a result, states had to increase their own Medicaid spending, on average, $26.7 billion from 2017 to 2022 from their own sources.
As of 2025, all but 10 states have expanded Medicaid.[6] Those states are shown in Figure 2.
Figure 2: States that Have Not Expanded Medicaid as of 2025
Sources:KFF tracking and analysis of state actions related to adoption of the ACA Medicaid expansion and Searing, Adam. “Federal Funding Cuts to Medicaid May Trigger Automatic Loss of Health Coverage for Millions of Residents of Certain States.” Say Ahhh! Georgetown Center for Children and Families, November 27, 2024
How Much Does Medicaid Cost? Who Pays?
Given that Medicaid is a joint federal and state program, it is important to examine the costs of Medicaid at the federal and state levels. At the federal level, Medicaid, the Children’s Health Insurance Program (CHIP), and other healthcare marketplace subsidies enacted by the ACA cost $759 billion in FY 2024. Put another way, for every dollar the federal government spent, eleven cents of that dollar went to Medicaid, CHIP, and the ACA subsidies.[7]
At the state level, Medicaid accounts for about 30 percent of total state spending (capital inclusive) and is the single largest expenditure in all state budgets. For every dollar the average state spends, thirty cents go to Medicaid—only ten cents come from state revenue while the remaining 20 cents come from federal transfers.[8]
Although Medicaid was designed to be a “joint” funding program, state policymakers have found ways to get the federal government to cover the lion’s share of Medicaid spending. This reflects the incentives elected officials face: using accounting gimmicks to offer more generous Medicaid spending while passing the cost to federal taxpayers can help them win reelection.
This problem was exacerbated by Medicaid expansion under the ACA. Figure 3 (recreated from the CRS report) shows the breakdown of federal and state Medicaid spending. The percentages atop each column indicate the federal share of total Medicaid spending.
Figure 3: Federal and State Shares of Medicaid Spending
Sources: Congressional Research Service “R43357: Medicaid: An Overview,” Figure 6: Federal and State Actual Medicaid expendituresCMS, Form CMS-64 Data as reported by states to the Medicaid Budget and Expenditure System, as of May 29, 2024, at https://www.medicaid.gov/medicaid/financial-management/state-expenditure-reporting-for-medicaid-chip/expenditure-reports-mbescbes. CPI-U inflation data collected from US Bureau of Labor Statistics
Notes: CMS, Form CMS-64 Data as reported by states to the Medicaid Budget and Expenditure System, as of May 29, 2024, at https://www.medicaid.gov/medicaid/financial-management/state-expenditure-reporting-for-medicaid-chip/expenditure-reports-mbescbes.
In the end, federal taxpayers are footing the bill for Medicaid. However, as the national debt continues to strain the federal budget and crowd out other priorities, policymakers in DC are desperate to cut costs. One likely area is federal Medicaid spending. If the federal government were to change the matching rates of either traditional Medicaid or Medicaid expansion, state spending on Medicaid would rapidly increase and crowd out other spending. In more fiscally distressed states, this could spur a fiscal crisis.
How Does Medicaid Impact Healthcare?
The size of Medicaid means that it shapes almost every corner of the American healthcare system, from hospital and acute care to long-term care to medical research. The program covers one in five Americans and finances 19 percent of all health spending in the United States. Here are some of the results of that influence.[9]
Increasing Coverage with Little to Show for Health Access or Outcomes
Medicaid increases healthcare coverage. Thanks to the Medicaid Expansion under the ACA and more generous federal matching programs created during the COVID-19 era and through the Biden administration’s stimulus packages, enrollment in Medicaid dramatically increased and the percentage of uninsured Americans decreased, reaching an all-time low in 2022.[10]
Additionally, while use of healthcare services increased, other negative outcomes emerged that decreased access to care, especially for those in traditional Medicaid. Cannon (2022a) notes that the Medicaid Expansion under the ACA creates an incentive for state policymakers to prioritize Medicaid expansion group recipients over traditional Medicaid recipients.[11] Blase and Gonshorowski (2025) confirmed these findings, noting that Medicaid expansion decreased access to care, crowded out private options, and shifted funds away from the poorest Medicaid recipients.[12]
In a review of the literature, Sigaud (2025) also finds depressing results[13] States that expanded Medicaid saw longer wait times and reduced access to care for traditional Medicaid enrollees. Additionally, he notes that symptoms of depression increased among near-elderly adults on Medicaid before and after expansion, especially among rural residents with extremely limited access to mental health providers. He also notes slower ambulance response times and greater delays in the emergency room.
Cementing the Relationship Between Employment and Healthcare
Medicaid expansion under the Affordable Care Act further entrenched employer-sponsored insurance (ESI) as the backbone of American healthcare. The ACA kept the ESI tax structure in place, essentially creating what Cannon (2022b) calls “an implicit penalty on workers who do not (a) surrender control of a sizable portion of their earnings to an employer; (b) enroll in a health plan that their employers choose, control, and revoke upon separation; and (c) pay the balance of the premium directly.”[14]
In an ideal world, Americans would not need to leave their jobs to change healthcare provider networks. Unfortunately, if Americans want a different health insurance package, they must “fire” their employer, pay a large tax penalty for choosing an employer-sponsored plan, or be stuck with an inferior, public option.
Increasing the Cost of Healthcare
Medicaid costs for healthcare are much greater than the costs of healthcare in the private sector. In my AIER paper “The Work vs Welfare Tradeoff Revisited,” I found that Medicaid paid more per full-year equivalent enrollee than the average annual single premium for an employer-sponsored plan in 43 states.[15] Despite the higher payments, health outcomes for Medicaid recipients are not better than those of Americans with private insurance.
The reason why Medicaid is so costly comes from the incentives created under the joint federal-state funding relationship, as discussed in the previous section. Cannon (2022a) elaborates, “Spending $1 on police buys $1 of police protection. Spending $1 on Medicaid, however, buys $2 to $10 of medical or long-term care. Medicaid rewards states for spending the marginal dollar on medical and long-term care even when spending it on police, education, or transportation would provide greater benefit.”[16]State officials have an incentive to maximize Medicaid while cutting basic public services. The open-ended federal matching system allows states to maximize federal matching dollars (especially for expansion populations) through gimmicks such as provider tax loopholes.[17]As spending on the expansion population increases, traditional Medicaid enrollees are pushed aside, leading to less access to care and worsening health outcomes.
The Government Accountability Office (GAO) regularly lists Medicaid (and its relative Medicare) among the “High-Risk” list for improper payments. The GAO notes that Medicaid program integrity must be strengthened through both legislation and “coordinated effort across multiple entities.”[18] Additionally, America is one of the most charitable nations in the world. In closing, Mueller opines,
In other words, Medicaid is rife with waste, fraud, and abuse, and fixing it is no small task.
Increased Regulatory Complexity
Medicaid also has a significant impact on the nature and shape of healthcare regulations. Federal rules dictating how states shape their Medicaid policies discourage innovation, research, and flexibility because state policymakers want to maximize those federal matching dollars. Furthermore, states will shape their own healthcare regulations to ensure compliance with federal Medicaid guidelines and maximize federal Medicaid funding. This results in states limiting access to new therapies to control costs.
What Do the 2025 Policy Changes Mean for Medicaid?
In 2025, two major policy changes have impacted Medicaid: proposed changes under the “One Big Beautiful Bill” (H.R. 1) and a Centers for Medicare and Medicaid Services proposed rule to close a provider tax loophole. These changes have the potential to provide immediate fixes to Medicaid, but much deeper reforms are needed.
The largest change comes from the legislative and CMS rule changes toward Medicaid provider taxes. The changes in H.R. 1 phase the Medicaid provider tax rate from 6 percent to 3.5 percent and freeze any new provider taxes created[19] It would also mandate waiver resubmissions and suspend existing approvals in noncompliant states. These reforms would ensure Medicaid financing aligns with federal intent, helps reduce wasteful spending, and prevents states from misusing federal Medicaid funds for other general fund programs.[20] It would also mandate waiver resubmissions and suspend existing approvals in noncompliant states. These reforms would ensure Medicaid financing aligns with federal intent, helps reduce wasteful spending, and prevents states from misusing federal Medicaid funds for other general fund programs.
Additionally, H.R. 1 also strengthens work requirements and eligibility checks, ensuring that verification standards are improved and states are allowed to remove ineligible enrollees from Medicaid.
These reforms, unfortunately, only scratch the surface. Deeper changes to Medicaid (as well as healthcare broadly) are needed. One such change is offered by economist David Rose. Rose writes,
“To put it simply, eliminate Obamacare, Medicare, and Medicaid and replace them with a national healthcare voucher system. This transformative change for American healthcare could be limited to the level paid for with a national sales tax, and our unfunded liability problems would simply disappear. While, for practical reasons, this would likely have to start at the national level, the goal could be to then spin it off to the states.”[21]
There is no shortage of ideas available for healthcare reform. The problem lies in changing the incentives that millions in the healthcare sector face (both in government and the private sector) that keep them maintaining the status quo.
Conclusion
Medicaid was designed to provide a safety net for the most vulnerable Americans. After sixty years, trillions spent, and millions of Americans enrolled, the program has little to show for it. It has strayed from its mission of helping the poor because policymakers prioritize maximizing federal matching rates. Medicaid spends more yet fails to provide better health care access or health outcomes, increases costs, and discourages choice and innovation in healthcare.
The United States—the wealthiest nation in history—and its people deserve health care that delivers access, valuable health outcomes, affordability, and choice. Market-driven solutions can provide such a system.
Footnotes
[1] Social Security Administration. Medicaid. In Annual Statistical Supplement to the Social Security Bulletin, 2015. https://www.ssa.gov/policy/docs/statcomps/supplement/2015/medicaid.html.
[2] Congressional Research Service. Medicaid: An Overview. R43357. Washington, DC: Library of Congress, 2023. https://www.congress.gov/crs-product/R43357.
[3] Ibid.
[4] Ibid.
[5] KFF. “Federal Matching Rate and Multiplier.” KFF State Health Facts. Accessed July 9, 2025. https://www.kff.org/medicaid/state-indicator/federal-matching-rate-and-multiplier.
[6] KFF. “Status of State Medicaid Expansion Decisions.” KFF. Accessed July 9, 2025. https://www.kff.org/status-of-state-medicaid-expansion-decisions.
[7]
[8]
[9] Office of the Assistant Secretary for Planning and Evaluation. The Benefits of Expanding Medicaid Eligibility to Low-Income Adults: Evidence from State Expansions. U.S. Department of Health and Human Services, March 28, 2022. https://aspe.hhs.gov/reports/benefits-expanding-medicaid-eligibility.
[10] Office of the Assistant Secretary for Planning and Evaluation. 2022 Uninsurance Rate at an All-Time Low: New Estimates Highlight the Role of the ACA and Medicaid Expansion. U.S. Department of Health and Human Services, September 2022. https://aspe.hhs.gov/reports/2022-uninsurance-at-all-time-low.
[11] Cannon, Michael F. Cato Institute. “Medicaid and the Children’s Health Insurance Program.” In Cato Handbook for Policymakers, 9th ed., 2022. https://www.cato.org/cato-handbook-policymakers/cato-handbook-policymakers-9th-edition-2022/medicaid-childrens-health-insurance-program#perverse-incentives.
[12] Blase, Brian and Gonshorowski, Drew. “Resisting the Wave of Medicaid Expansion: Why Florida Is Right.” Paragon Institute. May 1, 2024. https://paragoninstitute.org/medicaid/resisting-the-wave-of-medicaid-expansion-why-florida-is-right.
[13] Sigaud, Liam. “Losing Focus: How the ACA’s Medicaid Expansion Left Traditional Enrollees Behind.” Paragon Prognosis, February 10, 2025. https://paragoninstitute.org/paragon-prognosis/losing-focus-how-the-acas-medicaid-expansion-left-traditional-enrollees-behind/#:~:text=A%202021%20analysis%20in%20Health,adverse%20outcomes%2C%20including%20higher%20mortality.e.
[14] Cannon, Michael F. Cato Institute. “The Tax Treatment of Health Care.” In Cato Handbook for Policymakers, 9th ed., 2022. https://www.cato.org/cato-handbook-policymakers/cato-handbook-policymakers-9th-edition-2022/tax-treatment-health-care#the-tax-exclusion-for-employer-sponsored-health-insurance.
[15] Savidge, Thomas. “The Work vs. Welfare Tradeoff Revisited.” American Institute for Economic Research, June 17, 2022. https://aier.org/article/the-work-vs-welfare-tradeoff-revisited/#medicaid.
[16] Cannon (2022a). supra note 11.
[17] Blase, Brian. Medicaid Provider Taxes: A Gimmick that Exposes the Flaws in Medicaid’s Financing. Arlington, VA: Mercatus Center at George Mason University, June 20, 2023. https://www.mercatus.org/research/research-papers/medicaid-provider-taxes-gimmick-exposes-flaws-medicaids-financing.
[18] U.S. Government Accountability Office. Medicaid Financing: Actions Needed to Ensure Provider Taxes Do Not Undermine Federal Oversight. GAO-25-107743, May 2025. https://www.gao.gov/products/gao-25-107743.
[19] U.S. Congress.H.R. 1: “One Big Beautiful Reconciliation Act of 2025,” 119th Cong., 1st sess., § 71115, “Provider Taxes” (2025). https://www.congress.gov/bill/119th-congress/house-bill/1/text
[20] Centers for Medicare & Medicaid Services. Preserving Medicaid Funding for Vulnerable Populations by Closing Health Care-Related Tax Loophole: Proposed Rule. Fact Sheet. Washington, DC: U.S. Department of Health and Human Services, May 2, 2024. https://www.cms.gov/newsroom/fact-sheets/preserving-medicaid-funding-vulnerable-populations-closing-health-care-related-tax-loophole-proposed#_ftn2.
[21] Rose, David C. “Want to Fix Medicaid? Look to Milton Friedman.” The Daily Economy, June 6, 2025. https://thedailyeconomy.org/article/want-to-fix-medicaid-look-to-milton-friedman.
Americans are feeling the sting of President Trump’s tariffs. Consumer goods ranging from coffee and watches to toys and televisions are experiencing a jump in prices. Meanwhile, socialist frontrunner and New York City Democratic mayoral nominee Zohran Mamdani attacks private enterprise and advocates for even more state control. Amid this storm, the old right needs to hold the line on economics against the rising tide of protectionism on its own side. If it fails, American businesses and consumers will continue to suffer, and Mamdani-style socialism will look more attractive, especially to young people.
Mamdani’s recent victory in the NYC primary reminded Americans of what bad economic policy could look like on the left, namely government-controlled grocery stores and citywide rent freezes. To put it mildly, these proposals are economically naïve. Profit margins in the grocery industry are already razor thin, so the only way to sell food at lower prices is to lose money. Rent control has only ever hurt the people it is meant to help by reducing the incentive to build and thus creating shortages of rental housing.
No matter. Socialists like Mamdani continue to argue against all empirical evidence that if prices are too high, it is because a greedy Scrooge McDuck somewhere is squeezing the little guy for every last penny.
The White House is reportedly looking for ways to get Republican nominee Curtis Sliwa to end his campaign. Since Mayor Eric Adams dropped out last month, this would free up Andrew Cuomo to defeat Mamdani in November’s general election. Though this strategy seems likely to fail — polls show Mamdani defeating Cuomo, even in a one-on-one race — the very attempt is suggestive of a longstanding Republican consensus.
Until recently, the American right understood that only good economic policy could dampen the lure of bad economic policy. In other words, it understood that the correct response to seductive but dangerous proposals like Mamdani’s is economic dynamism, a key component of which is global trade.
The rise of Donald Trump has brought an end to this consensus. Trump believes that tariffs are an effective policy to reshore American manufacturing. This view is not only economically illiterate, but if left unchecked, it will fuel the rise of Mamdani-style socialism.
First, tariffs are a tax on consumers. If there was ever any doubt on this point, it is now undeniable. The Consumer Price Index — which measures the cost of a broad basket of everyday goods and services — rose by 2.9 percent in August from a year earlier, more than it would have without the tariffs. As a result, inflation stands at a stubborn 3.1 percent. Retailers from Walmart to Ikea are raising their prices due to the president’s trade war.
Trump has argued that short-term economic pain would ultimately be worth it when the tariffs bear fruit, presumably in the form of high-paying domestic jobs. This summer, the European Union, Japan, and South Korea pledged to invest hundreds of billions of dollars in the United States in exchange for tariff relief. The administration cited this as proof that its strategy was working.
Practical considerations cast serious doubt on this optimism. For one, the exact meaning of these pledges is unclear. Governments do not have the authority to compel domestic industries to make investments in the United States. Even if they did, the White House does not have the capacity to enforce the pledges, except of course by imposing more tariffs.
But the deeper problem with the president’s strategy is that it is simply unlikely to work. One 2025 study estimated that American manufacturing employment actually decreased by around 2.7 percent due to Trump’s 2018-2019 tariffs. Two earlier studies found similar results.
These findings are inconvenient for the protectionist right, which continues to maintain that raising the price of foreign goods will boost production of local ones. But American businesses do not only import finished products — they import inputs as well. Raising the price of imports can therefore harm the very businesses tariffs are meant to help by making production more expensive. For instance, steel-consuming jobs in America outnumber steel-producing ones 80 to 1. Raising the price of steel through tariffs thus benefits one worker at the expense of 80. The implication is clear: Trump’s tariff strategy will continue to hurt consumers with no upside for workers whatsoever.
Americans — young Americans in particular — are flirting with socialism because the cost of living is too high. Leftists like Mamdani feed on this legitimate frustration by proposing economic policies that should have been consigned to the dustbin of history long ago. Trump-style protectionism responds with an economic theory as outdated as the socialism it opposes. Regardless of who wins this fight, the American people lose.
The old right needs to stand in the breach.
Free enterprise and free trade will not solve all of America’s problems. They may not have the same ring as free jobs and free stuff. But at least they won’t make everything worse. Right now, they are what America needs.