In mythology, the badger is an unlikely symbol of wisdom. Resourceful and persistent, it digs deep for hidden answers, and surprises opponents with unexpected strength. That is why school founder Helga Hufflepuff chose it as its emblem in the Harry Potter universe — symbolizing overlooked abilities that became the quiet backbone of survival when Hogwarts faced its greatest test.
The Austrian School of economics shares that same spirit. While mainstream schools dominate universities with flashy equations and neat models, Austrians are underestimated, even mocked. The reason is simple: like the badger, they dig beneath surface appearances, uncovering answers that are often unnoticeable or even counterintuitive — and therefore easy to dismiss.
A Quiet Revolution
This “badger-like” digging first surfaced in the Marginal Revolution of the late nineteenth century. At a time when classical economists spoke in sweeping aggregates about “labor” or “society,” Carl Menger and his followers introduced a groundbreaking idea: value is determined by individual preferences, not by objective or intrinsic factors.
This perceptive insight overturned centuries of thought, explaining prices, exchange, and production in ways classical theories never could. At first, it was almost entirely ignored. But over time — and often without acknowledgment — its key fruits took root: the subjectivity of value and methodological individualism became pillars of modern economics.
Even entrepreneurship has since gained respect. Today it is taken seriously in growth theory, innovation studies, and policy debates. Before the Austrians, treatments of the entrepreneur were scattered and shallow. Menger’s student Viktor Mataja offered the first systematic theory in 1884. Still, like methodological individualism, it was brushed aside as too subjective, too anecdotal, and ill-suited to the statistical and aggregate mindset of the time.
The Tendency to Relapse
Even after these Austrian insights were absorbed, mainstream economics kept slipping back into old habits. Take methodological individualism. Textbooks still speak of “society,” “the nation,” or “the market” as if these were actors in their own right. The lure of central planning — and the convenience of those aggregates — makes it easy to forget that only individuals act.
Austrians, by contrast, carried methodological individualism and subjectivity to their full implications with the tenacity of a badger. They showed that aggregates have no independent reality.
Entrepreneurship shows the same pattern. Mainstream economics claims to include it, but their equilibrium models and assumptions of perfect information leave no real space for the entrepreneur. At best, they reduce it to something static and peripheral — an occasional flash of innovation or a managerial role — rather than central to the market process.
Austrians kept digging. By following the logic of human action, they uncovered the dynamic character of entrepreneurship as the driving force of markets. Israel Kirzner showed that entrepreneurship is not a rare act but a constant and universal process, woven into every choice to notice and respond to opportunities. Jesús Huerta de Soto deepened this view, stressing that entrepreneurial knowledge is exclusive, dispersed, and unrepeatable. Each discovery is tied to a particular person, time, and place. If missed, it may be gone forever.
And here again the badger analogy fits: not flashy, but indispensable. Digging through imperfect knowledge, uncovering unmet needs and unnoticed solutions, and pressing forward in uncertainty, the entrepreneur embodies the very process by which markets survive and evolve.
Warnings Unheeded
These counterintuitive insights may sound abstract, but the stakes could not be higher. When economists forget that only individuals act, or that entrepreneurship drives the market process, the result is not just bad theory — it is bad policy.
Again and again, Austrians have warned what would happen if governments ignored these truths. And again and again, those warnings were dismissed. The consequences were catastrophic. To see why these lessons matter, consider two of the clearest examples: socialism and nationalism.
The Blindness of Planning
In his 1920 essay on socialism, Ludwig von Mises warned that without the decentralized knowledge revealed by entrepreneurial discovery, central planners would be blind. At the time, this claim was dismissed as unrealistic. Central planning looked orderly, rational, even scientific — while markets seemed chaotic. The Soviet Union’s vast industrial output, second only to the United States, appeared to prove the skeptics right.
Yet Austrians, like badgers holding their ground, refused to give in. They insisted that what looked like “chaos” was actually the discovery process of millions of entrepreneurs, constantly adjusting and coordinating through prices. Their warnings were ignored. The result was shortages, stagnation, and famine. Only after the collapse of socialism did the world reluctantly concede that Mises had been right — though sadly, he didn’t live to see it.
The Nationalist Illusion
In his 1919 book Nation, State, and Economy, Mises warned that nationalism rests on a dangerous illusion: treating “the nation” as if it were a real actor. This anthropomorphism erases individuals, suppresses entrepreneurship, and turns neighbors into enemies by closing borders. His warning was ignored. Tariff wars deepened the Great Depression, and economic conflict escalated into global war. The badger had seen the danger — but the world paid the price for not listening.
The Return of the Old Illusions
Had the world heeded Austrian warnings, millions of lives — and their uniqueentrepreneurial insights — might not have been lost forever. Each death erased unrepeatable ideas and solutions, an invisible cost that no statistics can capture. The tragedy is not only that these lessons came too late, but that they are now fading again.
Artificial credit expansion, now rebranded as Modern Monetary Theory, promises prosperity without cost. Socialism, repackaged for a new generation, once again attracts idealistic youth. Economic nationalism, too, has returned in the form of tariff wars and protectionist trade blocs, once again framing commerce as conflict between nations rather than cooperation among individuals.
Each relapse carries the same dangers of stagnation, conflict, and war — along with a quieter toll: the missed entrepreneurial discoveries that vanish without a trace.
Like Hufflepuff’s badger, the Austrian School may be underestimated. But its perceptiveness, born of digging deeper, and its unyielding tenacity when others gave in to comforting illusions make it indispensable. The challenge for us is not to recognize these truths after disaster strikes, but to act on them before it is too late.
This paper investigates the effect of affordable housing obligations in New Jersey on cost of living, cost of housing, and actual housing production. New Jersey’s Mount Laurel court cases established a doctrine whereby municipalities must permit their “fair share” of affordably priced housing. At various points since then, the legislature has interpreted this doctrine with specific, quantitative targets for municipalities to reach, or it has declined to do so, leaving enforcement up to the courts, which in turn backed away for several years from enforcing affordable housing targets. These policy changes provide an opportunity to investigate whether affordable housing targets are having their intended effect. Based on synthetic control analysis, the results show no effect of affordable housing mandates on housing production and minimal to no effect of affordable housing mandates on housing costs.
1. Introduction
The Mount Laurel court cases in New Jersey established that “a developing municipality may not, by a system of land use regulation, make it physically and economically impossible to provide low and moderate income housing.”[1]
While the initial ruling merely held that municipal land-use regulations could not exclude everything other than large-lot single-family houses, the legislature has interpreted the Mount Laurel doctrine to say that municipalities have an affirmative obligation to construct deed-restricted affordable housing. Until 1985, the legislature did not act. Municipalities had widely flouted or challenged the 1975 New Jersey Supreme Court decision, leading to a “mass of protracted litigation.”[2] In 1983, the Mount Laurel II decision affirmed a “builder’s remedy” against municipalities that failed to meet judicially determined affordable housing targets, thereby incentivizing the legislature finally to act.[3]
The result was the Fair Housing Act of 1985, which established an independent body tasked with calculating each municipality’s “fair share” allotment of new affordable housing units, which would afford them safe harbor from builder’s remedy lawsuits. That body, the Council on Affordable Housing (COAH), issued its first round of fair share calculations in 1987, and they remained in force until 1993. Round II of COAH’s fair-share obligations were in force from 1993 to 1999, and after 1999 COAH went effectively defunct after its Round III calculations were invalidated by the courts. It was finally abolished in 2024 in favor of a new method of calculating fair-share obligations. Since 2007, then, when COAH’s Round III rules were invalidated, New Jersey municipalities have had to revert to the former method of judicial certification of compliance with the Mount Laurel doctrine.
How have the Mount Laurel doctrine and its varied interpretations by the legislature affected housing production and costs in New Jersey? To answer this question, we first need to understand the political economy of affordable-housing targets and inclusionary zoning programs.
2. The Effects of Affordable-Housing Mandates
In order to comply with COAH rules, New Jersey municipalities adopted inclusionary zoning. Inclusionary zoning comes in two forms: mandatory and voluntary. Mandatory inclusionary zoning requires that any new development of a specified size or kind set aside a percentage of units that must be rented or sold at an affordable price to low- or moderate-income consumers. Deed restrictions and income verification enforce the affordability requirement. Voluntary inclusionary zoning offers a developer a regulatory benefit, such as an increase in allowed density, provided a certain percentage of units are rented or sold at below-market rates in the same manner.
The Fair Housing Act of New Jersey requires municipalities to develop at minimum a voluntary inclusionary zoning program, but mandatory programs are ubiquitous throughout the state, according to a database maintained at inclusionaryhousing.org.
Inclusionary zoning only functions if the market-rate units in an inclusionary development are expensive. The developer has to make a large profit on those units to offset the losses on the units that are required to be sold or rented at below-market rates. If housing in general becomes affordable, then, inclusionary zoning does not work.
Inclusionary zoning has other curious effects. As a form of price control, it creates shortages and rationing. More people want the below-market units than are available, so they have to be allocated by lottery. Moreover, inclusionary zoning, at least in the mandatory form, reduces the supply of housing, because developers know they will make less profit from building than they would if there were no inclusionary requirements.
Empirical research largely confirms these theoretical expectations. Research in the Baltimore-Washington area finds that mandatory inclusionary zoning increases the cost of market-rate housing, though it might not affect new housing supply (Hamilton, 2021). An earlier study of California found that inclusionary zoning policies decreased the size and increased the price of single-family houses (Bento, et al., 2009). A study of San Francisco and Boston found that mandatory inclusionary zoning increased prices and reduced production in Boston while increasing prices during periods of rising prices and reducing prices during periods of falling prices in San Francisco, and not affecting production there (Schuetz, et al., 2011). Yet another study of California found strong adverse effects on production and prices (Means & Stringham, 2012). There’s only one contrarian study on the issue, finding that reduction in inclusionary zoning requirements in parts of California did not affect house prices (Hollingshead, 2015). It could be that these programs create hysteresis in housing markets once they’re implemented.
While these studies focus on mandatory inclusionary zoning, there are reasons to think that even voluntary inclusionary zoning, which is much more widespread, could have adverse consequences for housing production, particularly in a state like New Jersey or Massachusetts with a “builder’s remedy” available when municipalities fail to meet affordable housing targets.
Suppose that municipal leadership generally opposes new multifamily development. If a developer proposes a new market-rate multifamily development, it generally does not directly help the municipality meet its affordable housing target, because the units are usually not priced affordably enough. Moreover, since housing markets are supra-municipal, corresponding largely to commuting areas, municipal leaders may well realize that building market-rate housing has only weak effects on the overall affordability of housing within municipal boundaries, contributing rather to the affordability of housing throughout the local labor market. Realizing that they must meet their affordable housing targets, but disfavoring multifamily development generally, municipal leadership will have a clear incentive to deny planning permission for market-rate multifamily developments.
Anecdotally, the market-rate nature of a development (i.e., the lack of deed-restricted affordable units) frequently comes up as a justification for planning denials. State law doesn’t expressly protect municipal decisions to deny planning approval to market-rate multifamily projects, but municipalities generally enjoy broad discretion to deny approval for larger multifamily projects, through either site plan review, variance, or conditional use permit processes. When a lack of deed-restricted affordable units is combined with other features that may justify a denial, such as traffic impacts, a municipal land-use board may feel themselves on firmer ground to issue a denial than otherwise.
In this way, a state-level requirement that municipalities meet affordable-housing production targets will tend to reduce overall housing production and thereby increase overall housing costs.
Have affordable-housing production targets and inclusionary zoning had these effects in New Jersey? We need a credible empirical test comparing New Jersey to similar states.
3. Empirical Analysis
The empirical strategy here is to compare the rounds of binding affordable-housing obligations in New Jersey to the same periods in other states and to periods in New Jersey when there were not binding affordable-housing obligations. Of particular interest are two outcomes: building permits per capita (the best measure of housing production) and two measures of cost of living in general and cost of for-sale houses in particular. There is only one annual measure of state-level cost of living that goes back before 2008 (Berry, et al., 2000). We do not have annual data on rental costs, but the FHA produces an all-transactions house price index based on resales and appraisals. Their quarterly data are averaged by year to create an annual index.
The outcome variables are as follows: 1) total housing units permitted per capita, from the U.S. Census Bureau, 2) housing units in five-or-more-unit buildings per capita (these housing units are most likely to be affordably priced), 3) annual change in state cost of living, and 4) annual change in the state’s all-transactions house price index. The annual state-level building permits data go back to 1980 and up to 2023. The cost of living data go back to 1960 and up to 2007. House price data go from 1975 to 2024.
Figure 1 shows how total building permits per capita have evolved in New Jersey and two neighboring states since 1980. The vertical lines set off the period of 1985 to 1999, when Mount Laurel obligations were most seriously enforced, and the period 1999 to 2007, when Mount Laurel obligations were barely enforced at all, because the courts were waiting on a legislative solution that never came.
Figure 1: Total Building Permits per Capita in New Jersey and Neighboring States
We see here that before 1985, New Jersey was permitting a lot more units per capita than Pennsylvania and New York were. Shortly thereafter, however, New Jersey permitting plunged, and it remained more or less at Pennsylvania’s level until about 2012, when the state regained a small but steady advantage over its neighbors. These changes in permitting do not line up well with the enforcement of affordable housing obligations.
Figure 2 shows how building permits for units in buildings with five or more units evolved over time in the same group of three states.
Figure 2: Five-Plus Building Permits per Capita in New Jersey and Neighboring States
The results here are similar to those in Figure 1, except that Pennsylvania and New York switch places. Pennsylvania produces more housing than New York, but New York produces more multifamily housing than Pennsylvania, which is not surprising since New York is more urbanized. After 1990, New Jersey’s permitting of larger multifamily buildings closely tracks New York’s, but New Jersey did have a slightly higher rate between 2016 and 2022.
So far, the raw data do not show a strong effect of affordable housing obligations on housing production in New Jersey. New Jersey is the most densely populated state in the country, so it makes sense that New Jersey would produce a larger share of multifamily housing than a state like Pennsylvania. But only in the last few years has New Jersey produced more overall housing than Pennsylvania. There is no evidence that the 1985 to 1999 period specifically was more productive of housing in New Jersey than other periods, or that the 2000 to 2007 period was particularly unproductive, except perhaps relative to the post-2012 period.
Of course, building permits are a measure of quantity supplied, but economics teaches us that both supply and demand jointly determine an equilibrium. We cannot reason from quantity changes alone that New Jersey’s affordable housing obligations did not work, because perhaps New Jersey had abnormally low housing demand, which caused builders to want to build less regardless of regulations. If affordable housing obligations corresponded to periods of slow growth in the cost of living in New Jersey, we could infer that these obligations boosted housing supply after all.
Figure 3 shows the evolution of state cost of living from 1960 to 2007 for New Jersey and its larger neighbors.
Figure 3: Cost of Living in New Jersey and Neighboring States
This chart suggests as well that affordable housing obligations did not work. Cost of living in New Jersey grew more rapidly than in neighboring states between 1980 and 1990 and since then has remained consistently higher. This evidence suggests that demand for housing in New Jersey was growing rapidly in the 1980s, and more housing units would have been supplied to meet market conditions even in the absence of affordable housing obligations. It’s even possible that affordable housing obligations suppressed supply through the regulatory incentives established by inclusionary zoning.
Finally, Figure 4 plots the annual change in the house price index for all three states. It is important to note here that the house price index is specific to each state, so levels are not comparable across states, only changes are. Every state’s house price index is set to 100 in the first quarter of 1980.
Figure 4: Changes in House Prices in New Jersey and Neighboring States
New Jersey house prices mostly change in lockstep with New York’s. But between 2015 and 2020 there is a brief period when New Jersey’s house prices rose less rapidly than New York’s. We probably shouldn’t overinterpret six years of data in this time series, but in concert with the evidence from Figure 2 it might suggest that the period of court supervision of Mount Laurel obligations was more productive for housing than either the period of legislative supervision or the period when these obligations were mostly not enforced.
Still, these charts are not conclusive. We can investigate the effects of New Jersey’s affordable housing obligations using synthetic control analysis (Abadie, et al., 2015). Synthetic control creates a weighted average of similar units to the treated unit, then compares the actual results in the treated unit to the counterfactual results represented by the weighted average of similar units. The treatment effect of the intervention equals actual New Jersey’s value minus synthetic New Jersey’s value on an outcome.
I used the immediate lag of the dependent variable, population, personal income, land area, and number of local governments per square mile from Ruger and Sorens (2023) to create a “synthetic” New Jersey from other states. In the change in cost of living and change in house prices analyses, I also used the one-year lag of the level of each index to capture any scale effects occurring in long time series of price indices. This synthetic New Jersey is as similar as possible to the real New Jersey, allowing us to investigate the counterfactual building permits, cost of living, and housing costs that would have occurred in New Jersey in the absence of the Mount Laurel affordable housing obligations.
I look at two treatment periods, the first when the legislature made Mount Laurel obligations effective from 1985 to 1999, and the second when neither the legislature nor the courts were enforcing Mount Laurel obligations (2000 to 2007). Separate synthetic control analyses are run for each period.
Outcome:
Total units
Total units
5-Unit permits
5-Unit permits
Δ Cost of living
Δ Cost of living
Δ House price index
Δ House price index
Treatment period:
1985-1999
2000-2007
1985-1999
2000-2007
1985-1999
2000-2007
1985-1999
2000-2007
Massachusetts
0.66
0.58
0.82
0.22
0.6
0.29
0.44
0.2
Pennsylvania
0.24
0.17
0.17
0.22
0.52
Connecticut
0.13
0.46
0.14
0.38
New York
0.02
0.23
0.17
0.28
0.09
0.16
0.01
Florida
0.09
0.27
Nevada
0.07
0.04
Arizona
0.02
Hawaii
0.25
California
0.1
Table 1: Construction of Synthetic New Jersey in Each Analysis
Because I’m running eight different synthetic control analyses (two treatment periods combined with four outcomes), the precise content of synthetic New Jersey varies from analysis to analysis. Table 1 shows how synthetic New Jersey is constructed in each analysis; the numbers represent the weights on each state.
Unsurprisingly, neighboring states New York and Pennsylvania contribute a lot to many of these analyses. Massachusetts is the only state that contributes to synthetic New Jersey in every analysis. The biggest surprise is to see Hawaii enter as a significant contributor to synthetic New Jersey in the 1985–1999 house price index analysis. Otherwise, unusual states make up only a very small proportion of synthetic New Jersey in each instance.
Predictor balance was largely good, with treated and synthetic New Jersey matching closely on population, personal income, and effective competing jurisdictions per square mile. However, treated New Jersey land area was generally about a half to a quarter of synthetic New Jersey’s. New Jersey is abnormally small for its population and personal income (it is the most densely populated state), and it’s hard for the algorithm to replicate that pattern with other states.
Figure 5 shows the results of the synthetic control analyses of total building permits per capita for the two treatment periods.
Figure 5: Synthetic Control Analysis of New Jersey Total Building Permits
The synthetic control algorithm ends up replicating New Jersey’s pre-treatment permitting extremely closely in the earlier period and only moderately closely in the later period. New Jersey’s actual permitting fell below its counterfactual permitting over most of the earlier treatment period, corresponding to the first legislatively enforced Mount Laurel regime. But the differences are tiny in an absolute sense, and when we take into account normal variation in other states, they are not statistically significant in any year. The same is true of the treatment effects in the later period, corresponding to no enforcement of Mount Laurel obligations, except in 2000, where the result goes in the “wrong” direction (New Jersey built more than expected). In other words, neither legislative enforcement of Mount Laurel nor a suspension of Mount Laurel made any difference to New Jersey residential building permits.
Figure 6 presents equivalent results for five-unit production.
Figure 6: Synthetic Control Analysis of New Jersey Five-Unit Building Permits
The results are basically the same. The only statistically significant results based on standardized p-values are in 1986 and 2000, but they go in the “wrong” direction, suggesting that New Jersey had abnormally few five-unit permits in 1986 and abnormally many five-unit permits in 2000.
Figure 7 moves on to general inflation. Here, we would expect legislative enforcement of Mount Laurel to reduce state inflation rates and no enforcement of Mount Laurel to increase them, if the system actually promoted housing supply.
Figure 7: Synthetic Control Analysis of New Jersey Inflation
Here, we are able to model New Jersey’s pretreatment inflation extremely closely and accurately. Once again, we find essentially no effect of the Mount Laurel regime. None of the treatment effects are close to statistical significance, except in 2002, where the result suggests that the lack of Mount Laurel enforcement may have added a tenth of a percentage point to the state’s inflation rate. But for most years, the data suggest that Mount Laurel has made no difference to general inflation in New Jersey.
Next, Figure 8 looks at the results for change in the all-transactions house price index.
Figure 8: Synthetic Control Analysis of Change in New Jersey House Prices
The results here are all over the map, suggesting that Mount Laurel enforcement raised house prices in 1986 and 1987 and cut them in 1989, 1990, and 1991. The average treatment effect over the first period is -1.2, corresponding to about a 0.5 percent change in house prices over the whole 1985–1999 era. After enforcement was removed, house prices rose, but only in two years was that increase statistically significant: 2002 and 2006. The average treatment effect over this period is 11.7, corresponding to about a 2.7 percent change in house prices during that era. There is inconsistent evidence that Mount Laurel enforcement kept house prices down slightly.
When we put all this evidence together, it suggests that Mount Laurel enforcement did not increase housing supply. It may have cut housing prices slightly without increasing permitting, suggesting a reduction in demand for housing, but those changes were too slight to make any impact on broader state-level inflation.
4. Discussion
The results from the foregoing analyses suggest that the Mount Laurel doctrine and multiple rounds of affordable housing obligations dating back at least 39 years have done nothing, or next to nothing, to make housing more abundant or affordable in New Jersey. This is a disappointing result, perhaps, but it’s hard to see it as a surprising one, since New Jersey remains a costly state for housing and relatively slow-growing compared to Sunbelt states that make it easy to build.
Some of the evidence suggests that New Jersey built a lot of housing during 2015 to 2020, and that this period also corresponded to a moderation in house price increases. This was a period of judicial enforcement of Mount Laurel obligations without any legislative framework. At least, the results still support pessimism about the legislature’s ability to come up with criteria for Mount Laurel compliance that foster growth in housing supply.
These results also shouldn’t be surprising since the bulk of the scholarship on the question finds that inclusionary zoning policies tend to make housing less affordable, less abundant, or both. The Fair Housing Act’s mandating of voluntary inclusionary zoning and encouragement of mandatory inclusionary zoning has, at minimum, counteracted the intent of the law to make housing more available to families of modest income.
New Jersey is currently undergoing a fourth round of affordable housing obligations, and the process has generated much controversy. The law, Act 2 of 2024, requires the Department of Community Affairs to develop municipality-specific affordable housing obligations under a detailed, precise formula. Those obligations go into force this year.
Parts of the law’s formula are worth questioning. First of all, “Qualified Urban Aid” municipalities are exempted entirely from the law. This might make sense if all of these municipalities already offered abundant affordable housing, but that is not necessarily the case. Municipalities can qualify for this list if they have a high proportion of substandard and deficient housing or simply a high population density.
Second, Prospective Need – the new affordable housing obligation – is calculated on the assumption that 40% of the housing demand in every region and in every municipality will come from low and moderate income (LMI) households. This ignores the likelihood that LMI households prefer to live in some places rather than others (for instance, places with access to public transit or walkable to employment).
Communities end up with a higher quota if they have had more rapid commercial valuation growth over the previous decade. This provision encourages communities to squelch commercial development. Moreover, commercial valuation growth does not necessarily imply employment growth. Smart-growth principles suggest using employment growth instead to determine housing need.
The formula also includes an income capacity factor, which punishes communities not just for being wealthy, but also for having a small population, because it averages a purely income-based measure with a household-weighted income-based measure. To avoid penalizing communities for having a small number of households, the measure should simply be the household-weighted measure.
The law does take into account land capacity of the municipality, which is supposed to reduce new housing obligation for already built-out municipalities. However, the calculation depends in part on Geographic Information Systems (GIS) land-cover and tax map data that are often not sufficiently granular, accurate, and up-to-date for the purpose.
Finally, the “allocation factors” are simply averaged to produce the fair share calculation, with no justification. For example, the small community of Monmouth Beach has complained about its positive Prospective Need number, given that it has zero developable land.
Given these problems, it is no wonder that the renewed affordable housing obligations are facing strong resistance around the state. Sometimes state governments do need to put guardrails on the municipal zoning power, but in general, mandates on the number of units to produce do not work well, because they encourage wasteful litigation, and municipalities are often able to avoid them through sub rosa methods like delaying permits, requiring extra studies, and zoning land for development that is not actually developable.
5. Conclusion and Recommendations
Is the Mount Laurel doctrine working for New Jersey? Not in its legislative interpretations to date. The legislative framework based in 1985’s Fair Housing Act has demonstrably failed to solve the affordable housing problem in New Jersey. In fact, there’s no evidence it has increased permitting at all, and precious little that it has brought down the cost of housing in the state.
Three recommendations for reform follow.
As mentioned, Act 2 exempts urban municipalities from affordable housing mandates. This exemption makes little sense if one’s goal is to provide more affordable housing where there is demand for it. Act 2 could therefore be amended to apply to all municipalities in the state, and the quantitative housing mandates recalculated. Some lawmakers may question this approach on the grounds that higher affordable housing mandates for suburban and rural municipalities will be more likely to reduce residential segregation. But it is a generally valid maxim that when one aims at two targets at once, one risks hitting neither. A better way to deal with segregation would be to address its negative consequences directly.
A modest reform would shift affordable housing targets from municipal to regional bodies, either the existing county planning boards or new regional authorities created by legislation. These bodies could review development applications specifically for affordable housing developments, in consultation with the municipalities involved. A regional target system would be more flexible than the existing municipal target system, and could allow market demand to have a greater say in where these projects occur.
New Jersey lawmakers should consider repealing Act 2 entirely and discuss ways to leverage private property rights and the free market to grow housing supply, such as by conferring definite development rights for certain types of projects based on site and infrastructure conditions.
The state can also speed up permitting with shot-clocks, third-party permitting, and broadened exemptions from special permit requirements. The Mercatus Center publishes an annual report on the state legislative “toolbox” for housing, a useful source of ideas on this front (Furth, et al., 2024).
Instead of detailed affordable housing mandates that have spawned an entire litigation industry, the state should move toward regulatory reforms aimed at general housing abundance. The state could still financially reward towns that actually permit a lot of new building, but those rewards should come after the permits have been issued, not after mere rezonings. This approach would build a more collaborative relationship between the state and municipalities and also make it easier for builders to know what they can build and where, without having to go through years of legal rigmarole. These reforms would make housing more abundant where it’s needed, bringing down the cost and doubling down on New Jersey’s existing economic strengths, like a skilled, urbanized workforce and strong industrial and port infrastructure.
Acknowledgments
The author thanks Audrey Lane for editorial support and guidance and anonymous referees for helpful feedback. All remaining errors are the author’s responsibility.
References
Abadie, A., Diamond, A. & Hainmueller, J., 2015. Comparative Politics and the Synthetic Control Method. American Journal of Political Science, 59(2), pp. 495-510.
Aten, B. H., 2017. Regional Price Parities and Real Regional Income for the United States. Social Indicators Research, 131(1), pp. 123-143.
Bento, A., Lowe, S., Knaap, G.-J. & Chakraborty, A., 2009. Housing Market Effects of Inclusionary Zoning. Cityscape, 11(2), pp. 7-26.
Berry, W. D., Fording, R. C. & Hanson, R. L., 2000. An Annual Cost of Living Index for the American States, 1960-1995. Journal of Politics, 62(2), pp. 550-567.
Furth, S., Hamilton, E. & Gardner, C., 2024. Housing Reform in the States: A Menu of Options for 2025, Arlington, Va.: Mercatus Center at George Mason University.
Hamilton, E., 2021. Inclusionary Zoning and Housing Market Outcomes. Cityscape, 23(1), pp. 161-194.
Hollingshead, A., 2015. When and How Should Cities Implement Inclusionary Housing Policies?, Berkeley, Calif.: Cornerstone Partnership.
Means, T. & Stringham, E. P., 2012. Unintended or Intended Consequences? The Effect of Below-Market Housing Mandates on Housing Markets in California. Journal of Public Finance and Public Choice, 30(1-3), pp. 39-64.
Ruger, W. & Sorens, J., 2023. Freedom in the 50 States: An Index of Personal and Economic Freedom. 7th ed. Washington, D.C.: Cato Institute.
Schuetz, J., Meltzer, R. & Been, V., 2011. Silver Bullet or Trojan Horse? The Effects of Inclusionary Zoning on Local Housing Markets in the United States. Urban Studies, 48(2), pp. 297-329.
End Notes
[1] Southern Burlington County N.A.A.C.P. v. Township of Mount Laurel, 67 N.J. 151 (1975).
[2] Monaghan, Justin M., and William Penkethman Jr. “The Fair Housing Act: Meeting the Mount Laurel Obligation with a Statewide Plan.” Seton Hall Legis. J. 9 (1985): 585–619, 587.
[3] Southern Burlington County NAACP v. Mount Laurel Township, 92 N.J.
Central bank independence isn’t just wonky economic theory. It’s a stabilizing force in fiat money-using economies. When shortsighted politicians control monetary policy, the public suffers. Consider that with a 10 percent inflation rate, a $50,000 salary loses $5,000 in purchasing power annually—that’s a month’s rent, a year of groceries, or your child’s college savings evaporating.
Yet this crucial principle, once taken for granted in advanced democracies, is under threat from the left and right in the United States. Central bank independence prevents politicians from using monetary policy as a tool for short-term political gain at the expense of long-term economic stability. Politicians face election cycles every two to six years and have strong incentives to boost economic activity before elections—even if doing so creates problems later. If central bankers are insulated from these short-term political pressures, they can make the tough decisions needed to maintain price stability and economic health over the long run.
The current White House has taken various steps to undermine Fed independence. President Trump has repeatedly pressured Federal Reserve Chair Jerome Powell to cut interest rates and considered firing Powell when he refused. Trump appears to have pressured Michael Barr to step down as Vice Chair for Supervision and is currently trying to remove Governor Lisa Cook from the Fed Board for cause. In doing so, Trump demonstrates a fundamental misunderstanding of the Fed’s structure and independence.
Consider the rushed nomination of Stephen Miran to the Fed’s Board of Governors just before the last FOMC meeting. Rather than resigning from Trump’s Council of Economic Advisers, Miran opted to join the Fed while on unpaid leave from the White House. That looks like a clear violation of central bank independence, which raises some uncomfortable questions. Will Miran report behind-closed-doors Fed discussions back to the White House? Will Miran make monetary policy decisions based on his analysis of the available economic data or the political priorities of the President? How can markets trust that monetary policy will be conducted without political influence when a sitting Governor has the option to return to the White House in January?
The most dangerous threat to independence comes from what economists call fiscal dominance, where the central bank is forced to prioritize financing the government’s spending over its primary goal of controlling inflation. When governments “print money” to cover their deficits, they increase the money supply without any corresponding increase in economic demand for that money. The result is not just inflation, but very high rates of inflation. In 2023, inflation in Argentina spiked to 211 percent. That’s what life is like with fiscal dominance.
The Federal Reserve’s independence isn’t a courtesy extended to unelected technocrats. It’s a structural safeguard designed to protect families from the runaway inflation that has plagued other nations throughout history. It isn’t an abstract policy dispute. Central bank independence is the foundation that keeps your grocery bill stable and your savings secure.
Recent political pressures on Fed leadership threaten to undermine decades of hard-won credibility that have helped keep inflation in check and financial markets stable. It would take years to rebuild that credibility, if lost, and would likely require painful economic adjustments during the rebuilding phase. In the American case, it would also risk dedollarization. The US enjoys the exorbitant privilege of issuing the global reserve currency because the rest of the world expects the Federal Reserve will conduct policy reasonably well. That expectation—and, hence, the ability to issue the global reserve currency—depends on the Fed’s independence.
The lesson from around the world is clear: countries that politicize their central banks pay a steep price. America has not avoided that fate by accident. It has avoided that fate by design. Preserving central bank independence isn’t just good policy. It’s essential for promoting American prosperity.
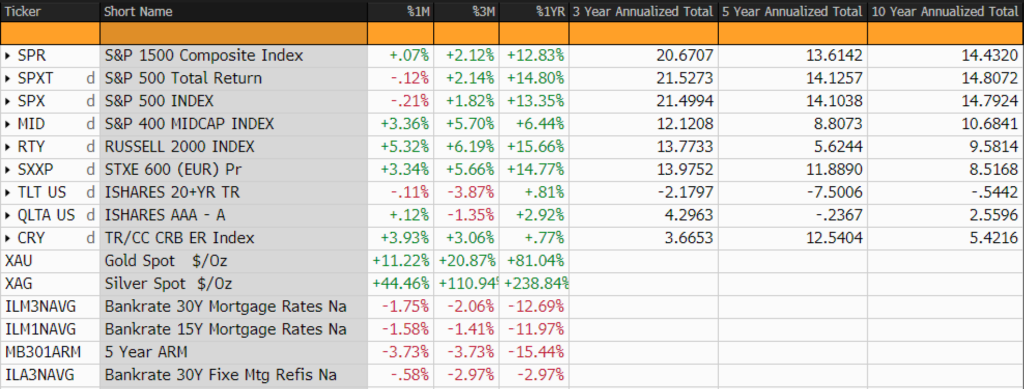
Gold has crossed $4,000 per ounce just 200 days after it passed $3,000. What began as a slow march from crisis to crisis has transformed into an accelerated sprint that is reshaping how savers, investors, and policymakers worldwide view the world’s oldest monetary metal. Beyond the simple symbolism of a round number, the current moment captures the increasingly uneasy intersection of macroeconomic stress, geopolitical instability, and feedback loops of momentum.
Several overlapping and reinforcing forces are driving gold’s surge:
Volatile trade policies, central bank division, and persistent fiscal dysfunction have fueled demand for safe assets. The US government’s repeated shutdown standoffs and spiraling debt dynamics make gold particularly attractive as “insurance;” particularly in the current shutdown, which seems likely to endure.
There is a tiresome critique that gold pays no dividend and has no yield, but that becomes an advantage when real (inflation-adjusted) rates turn negative. As the Federal Reserve has embarked upon an easing campaign, the opportunity cost of holding gold declines, giving the metal a fresh tailwind.
With the US dollar sliding, gold becomes cheaper for overseas buyers and more desirable as a reserve diversifier.
From Beijing to Brazil, central banks have been steadily adding to gold reserves. These moves are partly about diversifying away from the dollar and partly about hedging against sanctions or geopolitical shocks.
Exchange-traded funds backed by physical gold are attracting fresh capital. Some of this is retail money, but a large portion is institutional flows — allocations made with the intention of sticking through volatility.
Unlike oil or grain, gold production cannot be scaled quickly. Mines face capital shortages, political risk, and geological limits. Recycling adds some supply, but nowhere near enough to offset surging demand.
Rising public debt, unconventional fiscal policies, and questions about central bank independence are corroding faith in fiat currency. Each new episode of political dysfunction adds to the case for holding tangible assets.
For some investors, gold is not just an investment but a hedge against extreme scenarios: war, defaults, or sudden inflation spikes. These convex, “lottery ticket” flows add depth to the rally.
The result is a perfect storm of forces reinforcing one another. Gold is not rising for one reason; It is rising for many.
The temptation is usually to dwell on the neatness of round numbers: $4,000 per ounce is a record high: higher (obviously) than $3,000 per ounce with eyes already focused on $5,000 per ounce.
But a more revealing story emerges when we consider how quickly gold has moved between these thresholds. Gold first crossed $1,000 per ounce in 2008, during the financial crisis. It would take until August 2020 — nearly 12 years, or roughly 4,400 days — before gold finally broke through the $2,000 per ounce level. The journey from $2,000 in 2020 to $3,000 per ounce in March 2025 took about five years, or roughly 1,700 days. The latest leap has been the most astonishing. Gold cleared $3,000 per ounce in March 2025 and crossed $4,000 per ounce by October 2025. That’s a span of only about seven months (roughly 200 days).
This contraction in “days per new-thousand-dollar-ounces” is dramatic: from twelve years, to five, to less than one. It suggests a regime shift: either an accelerating loss of confidence in financial systems, or an extraordinary momentum cycle that could itself become self-reinforcing. The speed of these price leaps offers a richer narrative than psychological milestones alone. In practical terms, it raises questions: if the time to each new level is shrinking, are we watching a bubble — or are we witnessing a structural repricing of gold’s role in the financial system?
Quantifying the intervals provides an investigative framework: one can map “days per new-thousand-dollar-ounces” against macro factors such as real yields, central bank reserves, or debt-to-GDP ratios. If gold’s acceleration lines up with deteriorating fundamentals, it’s possible that the price move reflects more than momentum; it signals a profound market reassessment.
Gold at $4,000 per ounce is more than a headline. It is the sum of overlapping uncertainties: inflation, currency instability, debt, central bank policy, and geopolitical turbulence. But it is also a story told in numbers. The shrinking intervals between each successive $1,000 price gain speak both of, and to, a world that is changing faster than before. One where safe havens are sought not gradually, but urgently. It’s now quite clear that gold can reach $5,000 per ounce. The outstanding issue is how quickly it will take to do so, and what that speed tells us — if anything — about the evolving state of the global economy.
America is in the midst of a housing crisis. Homelessness hit a record high last year, rising 18 percent in 2024. Meanwhile, rent spiked by 50 percent in the past decade, rendering the typical American consumer ‘rent burdened’ for the first time in decades. Americans are also struggling to purchase homes, as all across the country the median-priced home is out of reach for the average income earner. The lack of affordable housing disproportionately harms marginalized groups — especially Black Americans who are twice as likely to rent, and more likely to suffer homelessness or eviction.
As a response, a growing number of cities and states are turning to rent control. In 2019, Oregon became the first in the nation to pass statewide rent control, and earlier this year, Washington State passed a bill capping rent increases at ten percent annually. The likely next mayor of New York City, Zohran Mamdani, has promised to freeze rent, expanding upon The Big Apple’s already stringent rent stabilization laws. Rent control even made it to the national stage in 2024 through the platform of Democratic Presidential candidate Kamala Harris. Although rent control is gaining political traction, it is a deeply flawed policy. Rent control reduces new development, erodes housing quality, and raises rent in the long run, all while contributing to gentrification and inequality. Rent control would only worsen the housing crisis.
Rent control artificially sets the price of rent below market value, discouraging developers from investing in new buildings; incentivizing landlords to take their units off the rental market. After St. Paul, Minnesota capped rent increases to three percent annually, new building permits decreased by 80 percent within three months of the policy being passed. And in San Francisco, rent control sparked a wave of rental units being converted to condos, causing renters in rent-controlled units to drop 25 percent. Choking supply leads to large rent increases in the long run as units become more scarce, especially in low-income areas where condominiums are unaffordable and development is sparse.
Rent control is successful at keeping tenants in their homes, but this comes at a cost: tenants are less likely to move out of units that don’t fit their needs. In order to continue paying lower rent, tenants will also remain in deteriorating housing, caused by rent control disincentivizing landlords from adequately maintaining units.
New renters are especially harmed by rent control, as when tenants stay put as it becomes almost impossible for new renters to find housing. Low housing mobility causes prices in the uncontrolled sector to balloon, as renters compete for the shrinking share of market-rate housing through bidding up the price. But even in the controlled sector, price ceilings are not always successful in keeping rent stable. For instance, a study of New York City’s housing stock found that the controlled sector actually paid more per month in rent than the uncontrolled sector. Rent control simply changed the timing of payment as opposed to causing a permanent decline in cost, as tenants merely exchanged higher rent in the long run for lower rent in the short run.
Proponents of rent control argue that it fights inequality, but in reality, rent control facilitates discrimination and leads to gentrification. If potential tenants are prevented from competing for housing on the basis of price, the biases of landlords play a far greater role in the distribution of housing. It is far easier to deny housing to minority groups when they are kept from outbidding the majority. Rent control also shifts the housing stock towards ownership, as properties are shifted off the rental market and become unaffordable for economically disadvantaged people. This widens the geographic and economic barriers between the haves and have-nots.
Rent control’s failure has been well-known among economists for decades, but the policy survives because it benefits interest groups and politicians. Current tenants receive artificially cheaper housing, and politicians garner political points through posing as protectors of the common man from greedy landlords. Rent control’s revival is representative of the increasingly populist political environment of America. The American public is losing faith in the market to provide solutions and is more willing to exchange individual liberty for quick fixes from central planners. Lowering housing costs will not come from shortcuts like rent control; it will come from allowing developers to build. Unleashing supply will lower rent, decrease homelessness, and reduce the cost-of-living burden working Americans carry every day.
Rent control has failed working Americans for decades. The new provisions from Mamdani and Washington State will be no different. Rent control in Washington State is projected to cause 7,000 fewer units to be built in the next decade, combined with a $1.1 billion reduction in rental property values. Mamdani can blame capitalism for New York City’s housing woes, and doing so has won him votes. However, his own policies are truly at fault. Nearly half of the rental housing in New York City qualifies for rent control, and rent has been completely frozen in qualified units four times in the past decade. Piling on even more rent control will only reduce the financial viability of the rental housing stock, decreasing supply, and raising rent.
Rent control is an issue that capitalism cannot afford to lose; Americans cannot afford the costs of fewer homes, run-down housing, and higher rent. Rent control is a safety net for politicians, not working Americans.
The reported death of US dollar dominance has been greatly exaggerated. The dollar’s demise has been repeatedly prophesied, supposedly threatened by any number of currencies including the euro, the yuan, and recent hints of a gold-backed currency from the BRICS countries (Brazil, Russia, India, and China).
Will the US dollar maintain its global dominance? Is there a role for bitcoin in US policy?
In a recent paper titled “The Treasury Standard: Causes and Consequences,” which was published in an edited volume of articles related to bitcoin, economist and AIER SMP Senior Fellow Joshua R. Hendrickson explores the historical relationship between central banking and national security. He finds that the US dollar dominance of the international monetary system and associated demand for US Treasury bonds helps reinforce America’s global military regime.
Further, the paper demonstrates how American officials and policies have actively contributed to expanding this system.
Hendrickson dubs this system “The Treasury Standard.” His paper has important implications for the future of bitcoin and how it might be treated by governments.
Read ‘The Treasury Standard’
There is much to like in “The Treasury Standard.” First, Hendrickson devotes two full sections to the government’s historical role in money. Section 2 starts with theories of commodity money and coinage before moving to bills of exchange and banknotes. The evolutionary process he describes fits the historical evidence.
Alternative theories emphasize the role of the state in creating money and determining the type of money used. As Hendrickson correctly notes, however, governments did not create money. Rather, they have continuously intervened in the monetary system to benefit themselves through “debasement, devaluation, and currency issuance,” often at the expense of the public. Despite such abuses, emergency spending powers are vital to the preservation of the nation itself. These costs and benefits must balance in order to minimize harm to the public and maximize long-run stability.
In the case of the United States, the ascendance of the Treasury Standard strengthened the growing relationship between national security and the monetary system. It solidified the Treasury’s international influence by making foreign powers reliant on US policy. However, persistent deficits, as experienced in recent decades, could destabilize this equilibrium.
Second, Hendrickson addresses an issue that is often avoided by economists: the role of policy in creating the Treasury Standard. Economists like simple stories about the effect of price controls and other policies, which might include capital controls or exchange rate manipulations in international finance. In contrast to the usual economic approach, Hendrickson describes the Treasury Standard as a mix of coordinated policies and political pressure to achieve a stated end: dollar dominance.
Policy Implications
While Hendrickson does not discuss bitcoin directly in the paper, he nonetheless provides some insight for thinking about bitcoin-related policies. Should the US government encourage bitcoin adoption? Should it hold bitcoin as a reserve asset? How would such pro-bitcoin policies affect its fiscal and monetary policy?
International Bitcoin Adoption
On the surface, greater bitcoin adoption would seem to undermine the Treasury Standard. But that only holds if one assumes those adopting bitcoin would have otherwise used the dollar. If, instead, one expects bitcoin to displace other major currencies, then its ascension might bolster the Treasury Standard by functioning as a neutral dollar alternative.
The Treasury’s decision to weaponize the dollar through sanctions and exclusions from the SWIFT bank routing network has made the dollar less attractive to foreign governments. Foreigners are already starting to turn away from the dollar, and foreign governments are actively developing dollar alternatives. In this context, the US benefits—that is, suffers less—from the adoption of a neutral alternative like bitcoin. Ideally, the Treasury would like foreigners to continue using the dollar, but if they do move away from the dollar, the Treasury would prefer them to switch to bitcoin rather than to the yuan, ruble, or some other currency controlled by one or more rival governments.
Of course, bitcoin is only useful to the US in this context if foreigners prefer it to the available alternatives. The success of the Swiss franc suggests they might use bitcoin as a reserve asset or for use in international trade. Due to its well-known stable long-term value, the Swiss franc is widely used in international trade as a vehicle currency–that is, between parties in non-Swiss nations, not with the country of Switzerland itself. As I have discussed elsewhere, “despite Switzerland having only the 19th-largest economy in terms of GDP, the Swiss franc is the 4th most commonly used currency in international trade and the 6th most widely held foreign reserve currency.” Thus, there seems to be strong demand for a stable currency in international trade, and bitcoin offers even more security against the risk of monetary expansions than the Swiss franc.
Government Bitcoin ‘Hodling’
What if the Treasury itself were to hold (or “hodl” in crypto lingo) bitcoin, as in proposals such as the Strategic Bitcoin Reserve? As Hendrickson has elsewhere explained, holding bitcoin would provide stability through diversification of the government’s assets, creating an option that could be exercised if the Treasury’s fiscal position deteriorates. The government’s commitment to bitcoin could have some self-reinforcing value of stabilizing the price, setting expectations and quelling complaints of the asset being intrinsically worthless.
Despite these benefits, it is not clear what effects “hodling” bitcoin would have on the federal government’s fiscal position. A higher bitcoin price (which most Bitcoiners take for granted, but many others question) would enable a bitcoin-holding government to pay down some of its debt. But it would not require it. In fact, politicians might respond to a higher bitcoin price—or, even an expected higher bitcoin price—by spending even more! Thus, a bitcoin reserve may not have the effects many Bitcoiners expect unless it is coupled with other policies that constrain spending.
BitBonds
Another proposal would see the government issue Treasury bonds that are at least partly backed by bitcoin, with any profits realized from the bitcoin backing shared between investors and the government. These “BitBonds,” proponents argue, would allow the government to take advantage of the risk reduction associated with diversification and, in doing so, lower the government’s cost of borrowing. Some private companies are already taking a similar approach in order to finance real estate loans. The BitBonds proposal is also similar to a proposal by Judy Shelton, which would see the US Treasury issue bonds backed by gold.
As with the bitcoin reserve proposal, it is not clear that issuing BitBonds would do much to improve the government’s financial position. Such proposals, on their own, do not constrain federal spending. Indeed, they relax the existing constraints on spending, which might encourage politicians to spend even more.
Bitcoin and the Fed
While the fiscal benefits of a bitcoin reserve or BitBonds are unclear, some point to potential monetary benefits. Would the establishment of a bitcoin reserve or the issuance of BitBonds provide an effective constraint on the actions of the Fed? Maybe. The answer depends on how such efforts were implemented.
Holding bitcoin as a reserve asset does not directly constrain the Fed. Domestic holders of Federal Reserve notes have not been able to redeem those notes for any asset since we went off the gold standard in 1933. Even if the Fed still owned gold today (which it does not), it would not be required to redeem dollars for gold. Similarly, if the Fed were to hold bitcoin reserves, it would be under no obligation to redeem its notes for bitcoin. It might sell its bitcoin to protect the purchasing power of the dollar, should the demand for dollars decline. But it would not be required to do so. Hence, holding bitcoin—on its own—would not constrain the Fed. It would merely give the Fed an option similar to that provided by other assets the Fed holds.
Although holding bitcoin would not constrain the Fed, the existence of bitcoin might. If bitcoin were to provide a neutral dollar alternative in international finance, as previously discussed, it would provide an alternative for dollar users concerned about higher inflation. The Fed would have to take that exit option into account when setting policy. Hence, the Fed’s ability to devalue the dollar might be limited if bitcoin provides dollar users with an attractive alternative. To be clear: I do not believe bitcoin represents a serious threat to the dollar in the near future. However, all changes are marginal, and marginally higher inflation would encourage some dollar users to rely more heavily on alternatives, including bitcoin.
The prospect of widespread switching to bitcoin is especially pertinent when considering extreme scenarios. Consider, for example, what would happen if the Treasury’s fiscal imbalances continue to the point of near default. Many assume the Fed would intervene to support the economy, lowering interest rates and inflating the dollar to avoid fiscal default. However, bitcoin—and, indeed, any credible dollar alternative—would limit the Fed’s ability to do so. Moreover, a general understanding that the Fed will be limited in its ability to mitigate the damage of default raises the expected costs of default. Hence, the existence of bitcoin might encourage politicians to rein in excessive spending or raise additional revenue in order to avoid approaching default in the first place.
Conclusion
Hendrickson takes history and politics seriously. In “The Treasury Standard,” he provides a theory of dollar dominance in the post-Bretton Woods monetary system based on the needs of emergency war financing while minimizing economic disruptions and explains how this balance may be destabilized by unsustainable US debt. While he focuses on the historical and political forces that established the current regime in the paper, he also provides a valuable starting point for thinking about the future role and potential consequences of bitcoin in the international monetary system.
This article is based on comments presented at theSatoshi Papers Symposium at the University of Austin (UATX), April 16, 2025.
In 1961, with global politics chilled by the looming Cold War, President Dwight D. Eisenhower delivered his farewell address, warning the nation of a military-industrial complex.
“In the councils of government, we must guard against the acquisition of unwarranted influence,” Eisenhower said. “The potential for the disastrous rise of misplaced power exists and will persist.” That is true of great corporate influence over policy, combined with political power, whether the buying branch is the military or some other federal power.
More than 60 years later, those words ring prophetic. A new industrial complex is taking shape, not in arms and artillery, but in silicon and circuitry.
In 2020, governments worldwide locked down businesses and citizens in an attempt to mitigate the spread of COVID-19. Mandated shutdowns brought supply chains to a standstill, leaving goods stranded and consumers waiting. Taiwan Semiconductor Manufacturing Company, TSMC, produces more than 50 percent of the world’s semiconductors, the miniscule computer chips found in nearly all electronic devices.
In 2022, The Daily Economy published contemporary coverage of the phenomenon:
If you’ve tried to make a purchase recently, anything from a new car to a laptop to a washing machine, you’ve likely felt the pinch of the supply shortfall. Any product relying on semiconductor chips is likely to be delayed, limited, or just plain unavailable. General Motors earnings slid 40 percent earlier this year, as nearly 95,000 vehicles languished for want of this or that semiconductor chip. Semiconductor shortages delayed the production of as many as eight million vehicles. While carmakers were hit by the shortage first, Goldman Sachs estimates 169 industries have been impacted. Sony couldn’t produce enough PlayStation 5 consoles to meet day-one demand. Apple and Samsung scrambled to find the chips suitable for LED backlighting in their tablets and laptops.
Firms that embed chips in their products kept around a 40-day supply on hand in 2019. That inventory crashed to less than five days in 2021, according to a Commerce Department report.
The market shock motivated Washington, DC to embrace a protectionist path, passing the 2022 CHIPS and Science Act, intended to re-shore semiconductor production. The Act’s cheerful backronym “for the Creating Helpful Incentives to Produce Semiconductors (CHIPS)” optimistically focuses on the intent, rather than the impact, of meddling such complex manufacturing.
Similar subsidy programs have since been launched in Europe, Japan, and South Korea, placing semiconductors at the center of a global industrial-policy arms race. The CHIPS and Science Act was designed to reduce dependence on Asian manufacturing and bring semiconductor production back to US soil. Well before the massive subsidies were introduced, Intel, Samsung, and Micron began construction of manufacturing centers in the US. TSMC from Taiwan, Samsung from South Korea, and Micron Technologies based in Boise, Idaho, are recognized as the “Big Three” in advanced semiconductor chip production. Their accelerating US expansion has also brought the industry into deeper entanglement with government.
Washington’s appetite for power knows no bounds. Not content to maintain his predecessor’s subsidies, US President Donald Trump is exploring options to take a direct government-owned share in not just Intel, but defense firms such as Lockheed Martin, Boeing, and Palantir. This continues an outlandish precedent where the US government owns a “golden share” of US Steel and most recently acquired an $11 billion or 10 percent stake in Intel.
Intel’s stock has halved since 2021, and remains a struggling firm despite $7.86B in CHIPS Act subsidies. Rather than allowing Schumpeterian creative destruction to take its course, policymakers decided to restore Intel’s position as the “national champion.” The government’s direct stake and subsidies ensured Intel’s survival and renewed its relevance. Washington now expects a quid pro quo from firms that took subsidies. In addition to this, Nvidia’s $5 billion, four-percent stake in Intel completed a triangle linking Silicon Valley’s crown jewel, Washington’s chosen national champion firm, and federal policymakers. By buying into a failing firm propped up by public funds, Nvidia bought itself a seat alongside Washington bureaucrats, outside the usual regulatory channels. That’s access its rivals can’t match.
When Washington subsidizes, invests in, and regulates the same industry, it stops being a neutral umpire and becomes an active player on the field. Policy decisions soon skew toward protecting the government’s investment and interests, rather than fostering true competition and innovation. Firms like TSMC, AMD, and Samsung will face a moral hazard, and replicate it to their competitors: it will now be much more cost effective to court politicians than to invest in R&D or compete on innovation — creating things buyers want.
James Buchanan, Nobel laureate and author of Politics without Romance, claimed we should never assume policymakers act as benevolent social planners, “Politicians do, in many cases, try to further what they think is the interest of the whole group, but in a sense, they’re just like the rest of us. Sometimes they’re motivated in terms of their own private interest, just like a businessman.” In this case, tying Washington’s interest directly to Intel’s success will shape semiconductor research and development, regulation, and global markets for years to come. Political and corporate incentives align to promote the interests of those who broker the deals — not the constituents or customers.
Reflecting upon recent financial disclosures, President Trump personally owns shares of Nvidia and Intel worth between $500,000 to $1,000,000. Coincidentally, in true Art of the Deal fashion, Intel’s stock rose 23 percent from the new partnership with Nvidia, while Nvidia’s own stock rose roughly 4 percent. The public is left wondering whether policy is being crafted to serve national security or private portfolios. Ultimately, the price of this alliance will be borne by consumers, who face higher costs and slower innovation, and by taxpayers, forced to fund the rescue of a company the market had already written off.
The line between policymaker and producer has all but vanished; the businessman and the bureaucrat are now one and the same. This is no longer a free market but a semiconductor cartel, where government, regulators, and industry titans coordinate the future of computing power. By combining subsidies, ownership stakes, and regulation, Washington leaves little room for genuine competition. This “tech industrial complex” locks in incumbents, crowds out rivals, and turns policy into corporate protection.
National economic policy of the favor-buying and rent-seeking kind will only accelerate, as other industries seek to garner favor and funding from buyable bureaucrats. The innovation engine that made Silicon Valley great risks becoming a state-sponsored utility. As Milton Friedman famously quipped, “If the federal government were put in charge of the Sahara Desert, within five years there would be a shortage of sand.”
To avoid turning the semiconductor industry into a barren desert, Washington must step back and let market signals and free investment irrigate innovation.
The Organization for Economic Co-operation and Development’s (OECD) latest economic outlook should serve as a wake-up call for Washington. While the organization upgraded global growth to 3.2 percent in 2025 after surprising resilience in the first half of the year, the US economy is still forecast to slow sharply — from 2.8 percent growth in 2024 to just 1.8 percent in 2025, before sliding to 1.5 percent in 2026. That’s barely half our historic post-war average of 3.5 percent. At that pace, America’s economy will take more than three decades to double in size — condemning a generation to slower wage gains, fewer opportunities, and diminished prosperity.
According to the Wall Street Journal, the OECD now believes the US will “slow less sharply” in the near term, but warns that tariffs will hit hard in 2026 as protectionist measures take full effect. And as CNBC reports, global growth was bolstered by emerging markets like Brazil, Indonesia, and India, along with AI-driven investment in the US and heavy fiscal stimulus in China. But these are temporary boosts. The real risks — soaring tariffs, policy uncertainty, and Washington’s fiscal excesses — remain firmly in place.
A Short-Term Lift, a Long-Term Drag
The OECD noted that “global growth was more resilient than anticipated in the first half of 2025,” partly because companies rushed production and trade ahead of the August tariff hikes. In the US, investment tied to artificial intelligence delivered a short-term bump, just as Beijing’s stimulus propped up Chinese output. But these front-loaded gains do not change the trajectory. As the OECD warned, “the full effects of tariff increases have yet to be felt” and are already becoming visible in consumer spending, labor markets, and prices.
The numbers confirm it. Effective US tariff rates jumped to 19.5 percent by August, the highest since 1933. That level of trade restriction is not just a policy tweak; it is a historic reversal of America’s pro-growth, pro-trade legacy. For now, firms are absorbing some of the added costs in margins, but the OECD expects the price impacts to cascade into higher consumer costs and tighter labor markets. Even with a small downward revision in the inflation forecast — US prices are now projected to rise 2.7 percent in 2025, down from the prior 3.2 percent — the warning is clear: tariffs are an inflationary tax that hurts both households and businesses.
Why This Matters for Families
For ordinary Americans, these projections are not just numbers on a page. A 1.5 percent growth economy means real wages stagnate, homeownership drifts further out of reach, and retirement savings erode in value. It means college graduates take longer to find stable, good-paying jobs. It means debt loads grow heavier as Washington’s national debt passes $37 trillion with fewer resources left to sustain it. Slow growth is the silent thief of the American dream.
Washington’s Hand in the Slowdown
The OECD’s language about “weak productivity growth” is a polite way of saying America’s government is strangling its own economy. Federal outlays have soared 88 percent since 2015, growing more than three times faster than the combined pace of population and inflation. That kind of fiscal explosion crowds out private investment and leaves fewer resources for innovators and families.
At the same time, regulation has piled up in every corner of the economy. From energy permitting delays to healthcare mandates to financial compliance, the bureaucratic state has made it harder to start businesses, expand production, or hire workers.
And then there’s industrial policy. Programs like the CHIPS Act pour billions into companies already investing heavily, distorting markets and rewarding political connections rather than productivity. The OECD cautions that these interventions may further weaken long-run growth prospects, and history agrees. Cronyism doesn’t create prosperity; it squanders it.
The Free-Market Path Forward
The solutions are not complicated, but they require political courage. Federal spending must be cut, then capped to grow less than population growth plus inflation — called sustainable budgeting. Tax policy should reward work and savings by flattening the code to eliminate distortions. Red tape should be slashed so that entrepreneurs can innovate without years of bureaucratic delay. And the Federal Reserve’s $6.6 trillion balance sheet should be reduced to restore honest price signals and control inflation.
Other nations prove this works. Ireland, Estonia, and Singapore consistently outperform larger economies by keeping taxes low, regulation light, and markets open. Their success is not an accident — it is the fruit of freedom. America can lead again, but not by doubling down on the failed policies of big spending and protectionism.
Conclusion: A Warning, Not Destiny
The OECD’s projections are a flashing red light, not a prophecy. America’s growth slowdown is not inevitable; it is the direct result of choices made in Washington. Tariffs, runaway spending, and regulatory excess are self-inflicted wounds. If left unchecked, they will make 1.5 percent growth the new normal, robbing a generation of prosperity.
But it doesn’t have to be this way. The fix is clear: spend less, regulate less, and trust people more. That’s how America doubled its economy in 20 years during its golden decades of growth, and it’s how it can do so again. The OECD has raised the alarm. Now it’s up to us to change course — before decline becomes destiny.
In August, the Associated Press reported that Nigeria had passed a law prohibiting the export of raw shea nuts — a key ingredient in many cosmetics.
Shea nuts are big business in Nigeria, a country responsible for about 40 percent of the world’s shea crop production. The initiative was designed to position Nigeria as a leading producer of refined shea butter and other skincare products.
“The ban will transform Nigeria from an exporter of raw shea nut to a global supplier of refined shea butter, oil, and other derivatives,” Nigeria’s vice president, Kashim Shettima, announced.
The ban is not permanent, officials said, and is slated for review after six months. That is a good thing, because evidence shows the prohibition is already having consequences — and not the intended ones. The BBC reports that the ban on exports had “backfired.”
“The intention was to boost local production of the finished butter…and so increase the amount of the profit which stays in Nigeria,” BBC reporter Todah Opeyemi said. “But the sudden shift has led to a fall in demand for the shea nut as there is not enough local capacity to process all of the country’s harvest.”
Filed a field report for BBC Pidgin on Nigeria’s 6-month ban on raw shea exports and how it’s hitting the women at the heart of the trade.
The govt hopes the ban will boost local processing, with a target for Nigeria to capture a fifth of the global shea market by 2030. pic.twitter.com/PNXdxly8F7
— Todah Opeyemi (@officialtodah) September 30, 2025
This might sound like a small matter, but it’s not. Nigeria produces roughly 350,000 tonnes of shea nuts each year. The industry supports millions of workers — predominantly poor women.
The Centre for the Promotion of Imports from developing countries (CBI), a Dutch government agency that helps developing-country producers access European markets, notes that shea butter is often called “women’s gold” because it provides livelihoods for over 2.2 million Nigerian women who work as shea nut collectors and processors.
Most of these workers are impoverished by Western standards. The BBC profiled Hajaratu Isah, a 40-year-old worker with six children who has spent her entire adult life preparing the fruit. Prior to the export ban, she could make as much as 5,000 naira ($3.30 USD) per day, which allowed her to purchase medicine and education services. Her earnings have reportedly fallen to less than half of that amount in the wake of the ban.
“Since the announcement, we have been suffering,” she told the BBC. “It does not affect only us but the entire chain of people working here, including the labourers.”
Nigeria’s shea nut ban is a classic case of backfire economics, where a policy ends up harming the very people it’s meant to help. To be fair, there was a certain logic to the Nigerian government’s central plan.
The plan was to get a bigger piece of the $6.5 billion shea market. Nigeria might account for nearly half of the world’s shea nut production, but it accounts for just a sliver of the global shea butter marketplace — roughly one percent — because the vast majority of its nuts are shipped out in raw form and processed elsewhere.
The solution seemed simple: instead of exporting raw shea nuts, refine them in Nigeria. It turns out, however, that refining shea nuts is not exactly easy.
I won’t claim to know anything about shea nuts — I couldn’t identify one if you showed it to me—but papers on the subject describe the refinement as an arduous task. Nuts have to be cleaned and sorted, cracked open, roasted just right, ground into a paste, and then squeezed to obtain butter — all without ruining the quality. In rural areas, much of this work is done by hand, but parts of the process require capital investment — decent equipment, lots of water, and clean storage (if not, the butter goes bad).
Nigeria does have at least one major shea nut processing plant: Salid Agriculture Nigeria Limited. On its website, it says it produces 100 tonnes of shea butter a day — about one-tenth of what Nigeria would require — and boasts that it “empowers” 45,000 rural women workers.
Salid Agriculture is “an ally of the current government,” according to the BBC. And the company stands to benefit from the policy. Plummeting demand for shea nuts has already resulted in a collapse in prices, which means the firm can acquire raw materials at a fraction of their former cost — and potentially dominate the newly protected domestic processing market.
The ban will no doubt be a windfall for some. But for millions of Nigerians, it could be devastating.
“When I heard about the export ban, I could not sleep,” one 55-year-old woman, Fatima Ndako, told the BBC, adding that 14 people live in her house. “The money we make is what we use to feed our families.”
We don’t know how Ndako and millions of other Nigerian women and their families will be affected by the ban on shea nuts, but students of economic history can be forgiven for fearing the worst. Attempts to plan and ban vast amounts of economic activity, even with the noblest intentions, can instead create human tragedies of catastrophic proportions. Similar efforts at economic self-sufficiency by force underlay the Holodomor famine in Ukraine under Stalin’s First Five-Year Plan, Mao’s disastrous Great Leap Forward, and Cambodia’s bloody attempt at agrarian utopia, among others.
“The curious task of economics,” Nobel laureate F.A. Hayek observed, “is to demonstrate to men how little they really know about what they imagine they can design.”
The idea that something as simple as an export ban on a nut can plunge millions into deeper poverty shows just how little control planners truly have over complex economic systems. Hopefully, the Nigerian government’s ham-fisted attempt to remake its shea industry by decree is quickly reversed and provides a lesson in humility — and not a humanitarian disaster.
The American housing market is no stranger to boom and bust cycles, but the current slowdown in existing home sales is remarkable both for its scale and its stubbornness. With sales in 2025 on track to reach their lowest levels in more than 25 years, the market appears to be in a deep freeze. That stark reality, highlighted recently by analyst Meredith Whitney, has often been treated as a secondary detail in coverage of the economy. Yet the depth of this freeze — and the reasons behind it — are central to understanding broader economic conditions.
Whitney’s phrasing is blunt: the market is “gummed up.” Unlike past downturns, when collapsing demand or financial crises abruptly cut off activity, today’s deep freeze is rooted in a peculiar mix of policy choices, pandemic aftereffects, and household-level psychology. The forces of supply and demand still operate, but they are being distorted in ways that have left buyers sidelined and sellers locked in place.
National Association of Realtors’ Housing Affordability Composite Index (1990 – present)
(Source: Bloomberg Finance, LP)
The most obvious factor is mortgage rates. Millions of households refinanced or bought homes in 2020 and 2021, when rates fell below 3 percent. Those “golden handcuffs” make moving far less attractive. A family that secured a $400,000 mortgage at 2.8 percent would face a payment increase of hundreds of dollars per month if forced to take out a new loan at today’s rates, which hover around 6 to 7 percent. Unsurprisingly, many simply refuse to sell, contributing to the freeze.
The stalemate can be traced to a web of overlapping dynamics. First, homeowners with ultra-low pandemic-era financing are clinging to their loans, unwilling to give up what may be the cheapest debt they will ever hold. Second, while price appreciation has slowed, home values remain historically elevated, keeping many first-time buyers on the sidelines. Third, the labor market, though stable, reveals caution through the “job hugging” phenomenon — workers staying put in their current roles rather than risking a change. If people are hesitant to change jobs, they are even more hesitant to take on new housing obligations.
During the COVID years, furthermore, stimulus checks, surging lumber prices, and waves of do-it-yourself enthusiasm fueled renovations. Many owners effectively upgraded their homes, reducing the incentive to move. Fifth, higher property taxes and soaring insurance premiums, particularly in coastal and hurricane-prone regions, add to the burden of ownership. For many, moving means not only higher mortgage rates but also higher carrying costs. Sixth, Whitney points to an overlooked trend: older Americans increasingly tapping home equity loans. By borrowing against their homes rather than selling, retirees extract liquidity while leaving housing supply tight. That subtle shift removes inventory from an already constrained market.
Any one of these factors alone might generate a modest slowdown. Taken together, they create a self-reinforcing freeze on transactions. Buyers hold back owing to the absence of affordable options; sellers, because moving would mean abandoning generationally cheap financing. Lenders, too, see less incentive to innovate when volumes are depressed. The result is a housing market neither collapsing nor thriving, but immobilized.
US Census Bureau US New One Family Houses Sold Annual Median Price NSA (1962 – present)
(Source: Bloomberg Finance, LP)
It’s an unusual state of affairs. In past housing cycles, a dropping demand eventually led to falling prices, which in time rekindled activity. Today, though, limited supply has prevented prices from correcting meaningfully. Even with sales activity at quarter-century lows, the median home price remains near record highs. That keeps affordability stretched, and thus the freeze remains intact.
The consequences extend far beyond real estate. Housing is one of the economy’s most powerful engines, driving construction employment, consumer spending on furnishings, and local tax revenues. When transactions dry up, a wide swath of related activity contracts. Realtors, appraisers, moving companies, landscapers, and retailers from Home Depot to Wayfair feel the pinch. The freeze also complicates Federal Reserve policy. Rate hikes are designed to slow demand, but the lock-in effect has amplified their impact. Instead of facilitating a natural adjustment, higher rates have created paralysis. Ironically, contractionary monetary policy could keep the shelter portion of service inflation higher for longer, since constrained supply props up rents and prices even as demand softens. (It bears mentioning that while Fed policy influences the shortest end of the US yield curve, mortgage rates track the 10-year and other, longer-term maturities.)
The freeze also reshapes household decisions in ways that are somewhere between difficult and impossible to measure directly. Younger families delay buying, renting far longer than intended. Older homeowners, instead of downsizing, remain in houses ill-suited to their stage of life. Geographic mobility suffers, which reduces the efficiency of labor markets. The decision to move across town, state, or across the country, once fairly common, has become an economic gamble. Meanwhile, creative financial behavior is emerging. Home equity loans and cash-out refinancing let older homeowners tap into their otherwise sequestered wealth, introducing risks in the process. Rising indebtedness among retirees could become a problem rising to policy levels if housing values stagnate or fall.
National Association of Home Builders’ Traffic of Prospective Buyers SA and US Census Bureau US New One Family Houses Total For Sale (1990 – present)
(Source: Bloomberg Finance, LP)
The key question is whether the impasse is temporary or persistent; frictional, or structural. A sharp drop in interest rates could unfreeze activity, but with inflation still elevated, such a shift seems unlikely in the near term. A major correction in prices could restore balance, but supply shortages make that outcome somewhat doubtful. The likeliest scenario is a market that muddles through: sluggish sales, elevated prices, and a large contingent of unsatisfied would-be market participants.
Whitney’s observation — that the reliance of older Americans on home equity loans may be a buried lead — underscores the complexity of the moment. The housing market is not simply a casualty of higher rates; it is the product of a confluence of pandemic-era choices, policy dynamics, and demographic realities. With sales at their lowest point in a quarter century, the US housing market is locked in a deep freeze, and understanding how — and when — it might thaw will be essential for prospective home buyers and sellers, investors, and policymakers alike.