New Found Gold Corp. (TSXV: NFG) (NYSE American: NFGC) (‘New Found Gold’ or the ‘Company’) is pleased to announce additional results from grade control drilling at the Keats zone (‘Keats’) excavation in the AFZ Core (‘AFZC’), completed as part of the Company’s 2025 drill program on its 100%-owned Queensway Gold Project (‘Queensway’ or the ‘Project’) in Newfoundland and Labrador, Canada.
Keats excavation grade control drill program highlights include:
- 508 g/t Au1 over 2.20 m2 from 16.80 m (NFGC-25-GC-024)
- 113 g/t Au over 3.75 m from 11.90 m (NFGC-25-GC-025)
- 9.29 g/t Au over 37.60 m from 12.00 m (NFGC-25-GC-027)
- 27.0 g/t Au over 10.00 m from 0.00 m (NFGC-25-GC-033)
- 31.5 g/t Au over 6.10 m from 0.60 m (NFGC-25-GC-021)
- 17.2 g/t Au over 9.05 m from 2.70 m (NFGC-25-GC-042)
- 24.5 g/t Au over 6.35 m from 24.65 m (NFGC-25-GC-031)
- 7.33 g/t Au over 19.80 m from 4.70 m (NFGC-25-GC-026)
- 3.75 g/t Au over 21.40 m from 0.10 m (NFGC-25-GC-035)
Melissa Render, President of New Found Gold, stated: ‘Building on the initial Keats zone grade control drill results released in late 2025, these new results continue to demonstrate the high-grade tenor of this zone. The 5 by 5 metre spaced drilling is confirming strong continuity of gold mineralization occurring at or within a few metres of surface. We look forward to updating the market with the results of the remaining 2025 grade control drilling from both Keats and the Iceberg zone when available.’
Work Summary
The results presented in this release include 1,230 m of drilling in 36 diamond drill holes (‘DDH‘) from the 2025 Keats excavation grade control drill program (‘KEGCDP‘; Figures 1 to 3). The KEGCDP was designed to improve confidence in the distribution of high-grade, near-surface gold mineralization and support mine planning as outlined in the Preliminary Economic Assessment (‘PEA‘) Phase 1 open pits (see the New Found Gold press release dated July 21 2025). Drill highlights, along with detailed results for these 36 DDH, are provided in Tables 1 to 3 below.
The full KEGCDP comprises 84 DDH totalling 2,773 m; a total of 1,866 m in 52 DDH, or 62% of results have been reported to date, including 36 DDH in this release and an initial 16 DDH in the Company’s press release dated December 1, 2025. Remaining results will be reported as they become available.
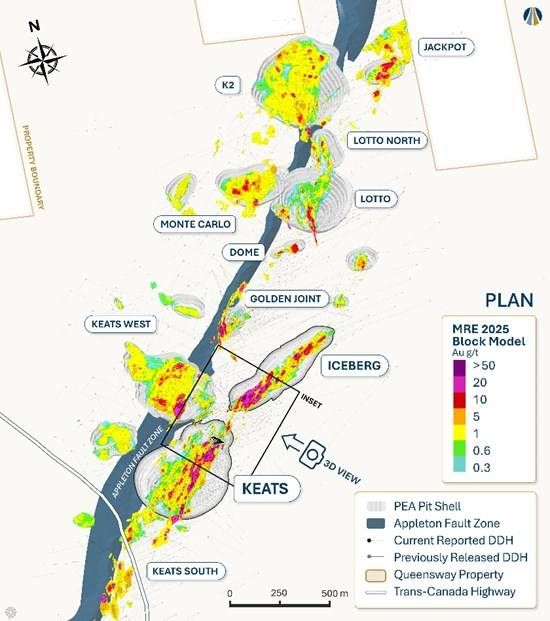
Figure 1: Plan view map of the AFZC with location of Keats and Iceberg excavation
grade control drill programs.
To view an enhanced version of this graphic, please visit:
https://images.newsfilecorp.com/files/7337/282330_77041155f49168ec_001full.jpg
- Keats excavation grade control drill program highlights (this press release):
- 508 g/t Au over 2.20 m from 16.80 m (NFGC-25-GC-024)
- 113 g/t Au over 3.75 m from 11.90 m (NFGC-25-GC-025)
- 9.29 g/t Au over 37.60 m from 12.00 m (NFGC-25-GC-027)
- 27.0 g/t Au over 10.00 m from 0.00 m (NFGC-25-GC-033)
- 31.5 g/t Au over 6.10 m from 0.60 m (NFGC-25-GC-021)
- 17.2 g/t Au over 9.05 m from 2.70 m (NFGC-25-GC-042)
- 24.5 g/t Au over 6.35 m from 24.65 m (NFGC-25-GC-031)
- 7.33 g/t Au over 19.80 m from 4.70 m (NFGC-25-GC-026)
- 3.75 g/t Au over 21.40 m from 0.10 m (NFGC-25-GC-035)
- 10.6 g/t Au over 6.60 m from 0.10 m (NFGC-25-GC-022)
- 9.94 g/t Au over 6.95 m from 0.70 m (NFGC-25-GC-030)
- 4.87 g/t Au over 10.55 m from 22.45 m (NFGC-25-GC-039)
- 3.37 g/t Au over 12.20 m from 0.55 m (NFGC-25-GC-017)
- 2.27 g/t Au over 16.35 m from 21.85 m (NFGC-25-GC-057)
- 1.45 g/t Au over 23.55 m from 8.05 m (NFGC-25-GC-032)
- 2.12 g/t Au over 13.75 m from 7.20 m (NFGC-25-GC-028)
- 1.52 g/t Au over 14.05 m from 3.50 m (NFGC-25-GC-045)
- 1.64 g/t Au over 12.65 m from 33.25 m (NFGC-25-GC-029)
- 1.78 g/t Au over 11.30 m from 4.70 m (NFGC-25-GC-034)
- 1.55 g/t Au over 12.50 m from 0.00 m (NFGC-25-GC-024)
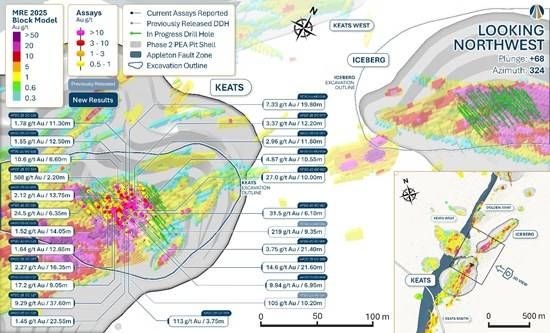
Figure 2: Keats and Iceberg excavations with proposed grade control drill holes and location of results received.
To view an enhanced version of this graphic, please visit:
https://images.newsfilecorp.com/files/7337/282330_77041155f49168ec_002full.jpg
The KEGCDP is testing a volume that is approximately 65 m long by 30 m deep by 40 m wide with a drill spacing of 5 m by 5 m and includes a near-surface high-grade region that was uncovered as part of the Company’s ongoing excavation program (see the New Found Gold press releases dated September 23, 2024, December 2, 2024, September 25, 2025, and December 1, 2025).
Results released to date correlate well with the initial mineral resource estimate (‘MRE‘) block model and indicate strong continuity of high-grade mineralized shoots at Keats, providing improved definition of their geometry, with most intervals occurring at or within a few meters of surface. The detailed geostatistical data from this phase of work will further validate our resource models, specifically by increasing confidence in grade-capping and influence-limiting parameters applied to high-grade intersections in advance of a MRE update and subsequent mine planning.
The Keats and Iceberg zones are hosted within the Keats-Baseline Fault Zone (‘KBFZ‘), a high-grade gold-bearing structure that has been defined over a current strike length of 1.9 kilometres (‘km‘). This corridor consists of a broad mineralized fault zone with limited deep drill testing to date. Drilling completed in 2024 confirms that the system extends to vertical depths of up to 1.1 km (see the New Found Gold press releases dated July 11, 2024, October 31, 2024, and April 29, 2025).
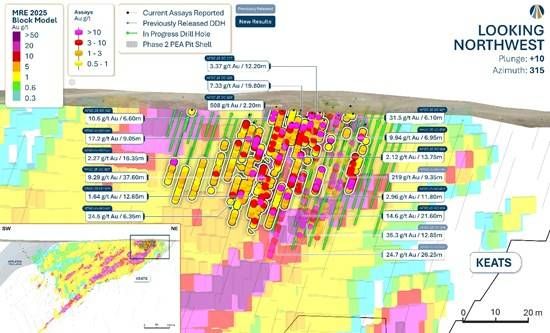
Figure 3: Keats longitudinal section view of grade control grid location (looking northwest, +/- 12.5 m).
To view an enhanced version of this graphic, please visit:
https://images.newsfilecorp.com/files/7337/282330_77041155f49168ec_003full.jpg
Looking Ahead
The 2025 Queensway drill program included 74,377 m of drilling in 614 diamond DDH, with approximately 75% of the drilling focused on the AFZC area to support advancement of the Phase 1 mine plan as outlined in the Company’s PEA and 25% focused on exploration targets such as the Dropkick zone (‘Dropkick‘). To date, approximately 50% of the results from 2025 drilling remain outstanding, as well as channel sampling results from the Lotto excavation. These results will be reported once available.
The 2026 Queensway drill program is underway, with four drill rigs currently active (see the New Found Gold press release dated January 21, 2026). Initial 2026 infill drilling is planned to first target PEA Phase 2 open pit resource conversion, transitioning later in the year to PEA Phase 3 underground resource conversion.
The Company plans to expand its grade control drilling beginning in Q2/26. The next phase of work will leverage results from the 2025 program to optimize drill hole spacing and program scope. This will include completing the initial grade-control drilling at the Iceberg excavation, commencing grade-control drilling at the Lotto excavation and potentially expanding the grade-control drilling at the Keats and Iceberg excavations. The objective of this work is to improve confidence in the distribution of gold mineralization and support mine planning as outlined for the PEA Phase 1 open pits.
Exploration drilling will focus on AFZC resource expansion including an initial grid-based program targeting the prospective corridor adjacent to the AFZ at Bullseye, continued step-outs at Dropkick, located 11 km north of the AFZC, and targeted segments of the AFZ at AFZ Peripheral. A regional drilling program testing advanced targets at Queensway South is in the planning phase and expected to commence in H2/26.
The Company plans to file an updated Technical Report for Queensway, which will include an updated mineral resource estimate, in mid-2026
Table 1: Drill Result Highlights.
| Hole No. |
From (m) |
To (m) |
Interval (m) |
Au (g/t) |
True Width (%) |
Zone |
| NFGC-25-GC-017 |
0.55 |
12.75 |
12.20 |
3.37 |
60-90 |
Keats Excavation |
| Including |
2.15 |
2.60 |
0.45 |
63.65 |
55-85 |
| NFGC-25-GC-021 |
0.60 |
6.70 |
6.10 |
31.47 |
70-95 |
Keats Excavation |
| Including |
1.65 |
3.40 |
1.75 |
98.64 |
70-95 |
| Including |
6.25 |
6.70 |
0.45 |
35.73 |
70-95 |
| And |
21.65 |
33.45 |
11.80 |
2.96 |
70-95 |
| Including |
21.65 |
22.10 |
0.45 |
20.78 |
70-95 |
| Including |
27.60 |
28.10 |
0.50 |
10.83 |
70-95 |
| Including |
31.00 |
31.30 |
0.30 |
25.62 |
70-95 |
| NFGC-25-GC-022 |
0.10 |
6.70 |
6.60 |
10.57 |
70-95 |
Keats Excavation |
| Including |
3.20 |
3.70 |
0.50 |
99.59 |
70-95 |
| Including |
6.05 |
6.70 |
0.65 |
21.90 |
70-95 |
| NFGC-25-GC-024 |
0.00 |
12.50 |
12.50 |
1.55 |
70-95 |
Keats Excavation |
| And |
16.80 |
19.00 |
2.20 |
507.70 |
70-95 |
| Including |
18.60 |
19.00 |
0.40 |
2788.50 |
70-95 |
| NFGC-25-GC-025 |
11.90 |
15.65 |
3.75 |
113.27 |
50-80 |
Keats Excavation |
| Including |
12.40 |
14.35 |
1.95 |
216.75 |
50-80 |
| NFGC-25-GC-026 |
4.70 |
24.50 |
19.80 |
7.33 |
65-95 |
Keats Excavation |
| Including |
4.70 |
6.00 |
1.30 |
90.49 |
65-95 |
| NFGC-25-GC-027 |
12.00 |
49.60 |
37.60 |
9.29 |
70-95 |
Keats Excavation |
| Including |
15.30 |
16.35 |
1.05 |
184.38 |
70-95 |
| Including |
16.90 |
17.90 |
1.00 |
23.39 |
70-95 |
| Including |
33.85 |
34.45 |
0.60 |
125.27 |
70-95 |
| NFGC-25-GC-028 |
7.20 |
20.95 |
13.75 |
2.12 |
70-95 |
Keats Excavation |
| Including |
7.70 |
8.10 |
0.40 |
32.55 |
70-95 |
| NFGC-25-GC-029 |
33.25 |
45.90 |
12.65 |
1.64 |
70-95 |
Keats Excavation |
| NFGC-25-GC-030 |
0.70 |
7.65 |
6.95 |
9.94 |
70-95 |
Keats Excavation |
| Including |
1.60 |
2.20 |
0.60 |
17.42 |
70-95 |
| Including |
4.45 |
5.00 |
0.55 |
16.08 |
70-95 |
| Including |
5.95 |
6.45 |
0.50 |
87.48 |
70-95 |
| And |
17.60 |
39.20 |
21.60 |
14.62 |
70-95 |
| Including |
21.45 |
22.20 |
0.75 |
61.99 |
70-95 |
| Including |
29.90 |
31.20 |
1.30 |
186.52 |
70-95 |
| NFGC-25-GC-031 |
24.65 |
31.00 |
6.35 |
24.48 |
70-95 |
Keats Excavation |
| Including |
29.05 |
30.15 |
1.10 |
132.61 |
70-95 |
| NFGC-25-GC-032 |
8.05 |
31.60 |
23.55 |
1.45 |
70-95 |
Keats Excavation |
| Including |
10.85 |
11.60 |
0.75 |
13.88 |
70-95 |
| NFGC-25-GC-033 |
0.00 |
10.00 |
10.00 |
27.01 |
70-95 |
Keats Excavation |
| Including |
1.10 |
2.60 |
1.50 |
168.65 |
70-95 |
| NFGC-25-GC-034 |
4.70 |
16.00 |
11.30 |
1.78 |
70-95 |
Keats Excavation |
| Including |
7.45 |
8.45 |
1.00 |
11.14 |
70-95 |
| NFGC-25-GC-035 |
0.10 |
21.50 |
21.40 |
3.75 |
70-95 |
Keats Excavation |
| Including |
0.85 |
1.80 |
0.95 |
40.74 |
70-95 |
| Including |
12.95 |
13.30 |
0.35 |
15.04 |
70-95 |
| NFGC-25-GC-039 |
22.45 |
33.00 |
10.55 |
4.87 |
70-95 |
Keats Excavation |
| Including |
28.40 |
29.50 |
1.10 |
16.24 |
70-95 |
| Including |
30.50 |
31.45 |
0.95 |
22.82 |
70-95 |
| NFGC-25-GC-042 |
2.70 |
11.75 |
9.05 |
17.24 |
40-70 |
Keats Excavation |
| Including |
7.20 |
8.95 |
1.75 |
53.22 |
40-70 |
| Including |
10.20 |
10.50 |
0.30 |
130.40 |
40-70 |
| NFGC-25-GC-045 |
3.50 |
17.55 |
14.05 |
1.52 |
70-95 |
Keats Excavation |
| Including |
8.75 |
9.20 |
0.45 |
10.12 |
70-95 |
| NFGC-25-GC-057 |
21.85 |
38.20 |
16.35 |
2.27 |
65-95 |
Keats Excavation |
| Including |
21.85 |
22.70 |
0.85 |
23.67 |
65-95 |
Note that the host structures are interpreted to be moderately to steeply dipping. Infill veining in secondary structures with multiple orientations crosscutting the primary host structures are commonly observed in drill core which could result in additional uncertainty in true width. Composite intervals reported carry a minimum weighted average of 1 g/t Au diluted over a minimum core length of 2 m with a maximum of 4 m consecutive dilution when above 200 m vertical depth and 2 m consecutive dilution when below 200 m vertical depth. Included high-grade intercepts are reported as any consecutive interval with grades greater than 10 g/t Au. Grades have not been capped in the averaging and intervals are reported as drill thickness. Details of all drill holes reported in this press release are included in Table 2 and Table 3 below.
Table 2: Summary of composite drill hole results reported in this press release for Keats.
| Hole No. |
From (m) |
To (m) |
Interval (m) |
Au (g/t) |
True Width (%) |
Zone |
| NFGC-25-GC-017 |
0.55 |
12.75 |
12.20 |
3.37 |
60-90 |
Keats Excavation |
| Including |
2.15 |
2.60 |
0.45 |
63.65 |
55-85 |
| NFGC-25-GC-018 |
0.35 |
7.10 |
6.75 |
3.03 |
70-95 |
Keats Excavation |
| Including |
1.40 |
1.85 |
0.45 |
29.82 |
70-95 |
| And |
15.50 |
18.00 |
2.50 |
1.36 |
Unknown |
| NFGC-25-GC-019 |
No Significant Values |
Keats Excavation |
| NFGC-25-GC-020 |
2.15 |
9.00 |
6.85 |
7.29 |
65-95 |
Keats Excavation |
| Including |
2.15 |
2.80 |
0.65 |
13.63 |
65-95 |
| Including |
6.80 |
7.60 |
0.80 |
46.46 |
65-95 |
| And |
14.45 |
16.95 |
2.50 |
2.06 |
70-95 |
| NFGC-25-GC-021 |
0.60 |
6.70 |
6.10 |
31.47 |
70-95 |
Keats Excavation |
| Including |
1.65 |
3.40 |
1.75 |
98.64 |
70-95 |
| Including |
6.25 |
6.70 |
0.45 |
35.73 |
70-95 |
| And |
21.65 |
33.45 |
11.80 |
2.96 |
70-95 |
| Including |
21.65 |
22.10 |
0.45 |
20.78 |
70-95 |
| Including |
27.60 |
28.10 |
0.50 |
10.83 |
70-95 |
| Including |
31.00 |
31.30 |
0.30 |
25.62 |
70-95 |
| NFGC-25-GC-022 |
0.10 |
6.70 |
6.60 |
10.57 |
70-95 |
Keats Excavation |
| Including |
3.20 |
3.70 |
0.50 |
99.59 |
70-95 |
| Including |
6.05 |
6.70 |
0.65 |
21.90 |
70-95 |
| NFGC-25-GC-023 |
0.00 |
7.00 |
7.00 |
2.98 |
70-95 |
Keats Excavation |
| Including |
3.50 |
3.80 |
0.30 |
32.45 |
70-95 |
| And |
24.00 |
32.90 |
8.90 |
3.39 |
70-95 |
| Including |
25.90 |
26.50 |
0.60 |
27.63 |
70-95 |
| NFGC-25-GC-024 |
0.00 |
12.50 |
12.50 |
1.55 |
70-95 |
Keats Excavation |
| And |
16.80 |
19.00 |
2.20 |
507.70 |
70-95 |
| Including |
18.60 |
19.00 |
0.40 |
2788.50 |
70-95 |
| NFGC-25-GC-025 |
11.90 |
15.65 |
3.75 |
113.27 |
50-80 |
Keats Excavation |
| Including |
12.40 |
14.35 |
1.95 |
216.75 |
50-80 |
| And |
20.60 |
28.65 |
8.05 |
1.90 |
70-95 |
| Including |
25.65 |
26.55 |
0.90 |
10.17 |
70-95 |
| And |
37.70 |
46.40 |
8.70 |
5.94 |
70-95 |
| Including |
38.90 |
39.50 |
0.60 |
75.27 |
70-95 |
| NFGC-25-GC-026 |
4.70 |
24.50 |
19.80 |
7.33 |
65-95 |
Keats Excavation |
| Including |
4.70 |
6.00 |
1.30 |
90.49 |
65-95 |
| NFGC-25-GC-027 |
12.00 |
49.60 |
37.60 |
9.29 |
70-95 |
Keats Excavation |
| Including |
15.30 |
16.35 |
1.05 |
184.38 |
70-95 |
| Including |
16.90 |
17.90 |
1.00 |
23.39 |
70-95 |
| Including |
33.85 |
34.45 |
0.60 |
125.27 |
70-95 |
| And |
52.90 |
55.00 |
2.10 |
1.90 |
70-95 |
| Including |
53.65 |
54.00 |
0.35 |
10.00 |
70-95 |
| NFGC-25-GC-028 |
7.20 |
20.95 |
13.75 |
2.12 |
70-95 |
Keats Excavation |
| Including |
7.70 |
8.10 |
0.40 |
32.55 |
70-95 |
| NFGC-25-GC-029 |
16.50 |
22.00 |
5.50 |
6.11 |
70-95 |
Keats Excavation |
| Including |
21.40 |
22.00 |
0.60 |
14.55 |
70-95 |
| And |
33.25 |
45.90 |
12.65 |
1.64 |
70-95 |
| NFGC-25-GC-030 |
0.70 |
7.65 |
6.95 |
9.94 |
70-95 |
Keats Excavation |
| Including |
1.60 |
2.20 |
0.60 |
17.42 |
70-95 |
| Including |
4.45 |
5.00 |
0.55 |
16.08 |
70-95 |
| Including |
5.95 |
6.45 |
0.50 |
87.48 |
70-95 |
| And |
17.60 |
39.20 |
21.60 |
14.62 |
70-95 |
| Including |
21.45 |
22.20 |
0.75 |
61.99 |
70-95 |
| Including |
29.90 |
31.20 |
1.30 |
186.52 |
70-95 |
| NFGC-25-GC-031 |
24.65 |
31.00 |
6.35 |
24.48 |
70-95 |
Keats Excavation |
| Including |
29.05 |
30.15 |
1.10 |
132.61 |
70-95 |
| NFGC-25-GC-032 |
8.05 |
31.60 |
23.55 |
1.45 |
70-95 |
Keats Excavation |
| Including |
10.85 |
11.60 |
0.75 |
13.88 |
70-95 |
| And |
35.70 |
41.65 |
5.95 |
1.19 |
70-95 |
| NFGC-25-GC-033 |
0.00 |
10.00 |
10.00 |
27.01 |
70-95 |
Keats Excavation |
| Including |
1.10 |
2.60 |
1.50 |
168.65 |
70-95 |
| And |
16.95 |
23.60 |
6.65 |
2.24 |
70-95 |
| Including |
17.60 |
18.25 |
0.65 |
10.60 |
70-95 |
| And |
34.75 |
37.70 |
2.95 |
1.65 |
45-75 |
| NFGC-25-GC-034 |
4.70 |
16.00 |
11.30 |
1.78 |
70-95 |
Keats Excavation |
| Including |
7.45 |
8.45 |
1.00 |
11.14 |
70-95 |
| NFGC-25-GC-035 |
0.10 |
21.50 |
21.40 |
3.75 |
70-95 |
Keats Excavation |
| Including |
0.85 |
1.80 |
0.95 |
40.74 |
70-95 |
| Including |
12.95 |
13.30 |
0.35 |
15.04 |
70-95 |
| And |
28.00 |
31.00 |
3.00 |
1.09 |
55-85 |
| NFGC-25-GC-036 |
No Significant Values |
Keats Excavation |
| NFGC-25-GC-037 |
28.60 |
33.40 |
4.80 |
1.61 |
70-95 |
Keats Excavation |
| NFGC-25-GC-038 |
4.35 |
11.50 |
7.15 |
1.93 |
55-85 |
Keats Excavation |
| And |
21.25 |
23.40 |
2.15 |
1.10 |
70-95 |
| NFGC-25-GC-039 |
10.15 |
12.60 |
2.45 |
1.01 |
60-90 |
Keats Excavation |
| And |
22.45 |
33.00 |
10.55 |
4.87 |
70-95 |
| Including |
28.40 |
29.50 |
1.10 |
16.24 |
70-95 |
| Including |
30.50 |
31.45 |
0.95 |
22.82 |
70-95 |
| NFGC-25-GC-040 |
No Significant Values |
Keats Excavation |
| NFGC-25-GC-041 |
3.50 |
7.30 |
3.80 |
2.77 |
45-75 |
Keats Excavation |
| Including |
6.80 |
7.30 |
0.50 |
10.64 |
45-75 |
| And |
16.55 |
26.20 |
9.65 |
2.56 |
70-95 |
| NFGC-25-GC-042 |
2.70 |
11.75 |
9.05 |
17.24 |
40-70 |
Keats Excavation |
| Including |
7.20 |
8.95 |
1.75 |
53.22 |
40-70 |
| Including |
10.20 |
10.50 |
0.30 |
130.40 |
40-70 |
| And |
17.55 |
24.35 |
6.80 |
1.19 |
70-95 |
| NFGC-25-GC-044 |
8.75 |
11.25 |
2.50 |
1.03 |
40-70 |
Keats Excavation |
| And |
15.25 |
17.40 |
2.15 |
1.05 |
40-70 |
| And |
21.40 |
29.45 |
8.05 |
1.21 |
40-70 |
| NFGC-25-GC-045 |
3.50 |
17.55 |
14.05 |
1.52 |
70-95 |
Keats Excavation |
| Including |
8.75 |
9.20 |
0.45 |
10.12 |
70-95 |
| And |
22.00 |
24.50 |
2.50 |
1.21 |
45-75 |
| NFGC-25-GC-047 |
24.45 |
27.10 |
2.65 |
1.00 |
70-95 |
Keats Excavation |
| NFGC-25-GC-049 |
4.40 |
11.40 |
7.00 |
1.65 |
70-95 |
Keats Excavation |
| NFGC-25-GC-051 |
24.80 |
31.05 |
6.25 |
1.32 |
70-95 |
Keats Excavation |
| NFGC-25-GC-053 |
10.50 |
13.60 |
3.10 |
1.37 |
40-70 |
Keats Excavation |
| And |
22.40 |
29.10 |
6.70 |
1.14 |
70-95 |
| NFGC-25-GC-054 |
20.70 |
29.15 |
8.45 |
2.36 |
70-95 |
Keats Excavation |
| Including |
20.70 |
21.70 |
1.00 |
10.30 |
70-95 |
| NFGC-25-GC-057 |
0.60 |
2.90 |
2.30 |
1.07 |
65-95 |
Keats Excavation |
| And |
11.15 |
15.35 |
4.20 |
6.21 |
65-95 |
| Including |
11.15 |
12.10 |
0.95 |
14.02 |
65-95 |
| And |
21.85 |
38.20 |
16.35 |
2.27 |
65-95 |
| Including |
21.85 |
22.70 |
0.85 |
23.67 |
65-95 |
| NFGC-25-GC-077 |
No Significant Values |
Keats Excavation |
| NFGC-25-GC-114 |
No Significant Values |
Keats Excavation |
Note that the host structures are interpreted to be moderately to steeply dipping. Infill veining in secondary structures with multiple orientations crosscutting the primary host structures are commonly observed in drill core which could result in additional uncertainty in true width. Composite intervals reported carry a minimum weighted average of 1 g/t Au diluted over a minimum core length of 2 m with a maximum of 4 m consecutive dilution when above 200 m vertical depth and 2 m consecutive dilution when below 200 m vertical depth. Included high-grade intercepts are reported as any consecutive interval with grades greater than 10 g/t Au. Grades have not been capped in the averaging and intervals are reported as drill thickness.
Table 3: Details of drill holes reported in this press release.
| Hole Number |
Azimuth (°) |
Dip (°) |
Length (m) |
UTM E |
UTM N |
Prospect |
| NFGC-25-GC-017 |
300 |
-45 |
30 |
658204 |
5427542 |
Keats |
| NFGC-25-GC-018 |
300 |
-45 |
21 |
658196 |
5427547 |
Keats |
| NFGC-25-GC-019 |
299 |
-45 |
15 |
658192 |
5427544 |
Keats |
| NFGC-25-GC-020 |
299 |
-45 |
34 |
658209 |
5427540 |
Keats |
| NFGC-25-GC-021 |
299 |
-45 |
39 |
658220 |
5427533 |
Keats |
| NFGC-25-GC-022 |
299 |
-45 |
12 |
658187 |
5427541 |
Keats |
| NFGC-25-GC-023 |
299 |
-45 |
39 |
658215 |
5427530 |
Keats |
| NFGC-25-GC-024 |
299 |
-45 |
22 |
658193 |
5427538 |
Keats |
| NFGC-25-GC-025 |
299 |
-45 |
46 |
658225 |
5427513 |
Keats |
| NFGC-25-GC-026 |
299 |
-45 |
30 |
658204 |
5427538 |
Keats |
| NFGC-25-GC-027 |
299 |
-45 |
61 |
658217 |
5427512 |
Keats |
| NFGC-25-GC-028 |
299 |
-45 |
32 |
658198 |
5427534 |
Keats |
| NFGC-25-GC-029 |
298 |
-45 |
53 |
658210 |
5427516 |
Keats |
| NFGC-25-GC-030 |
298 |
-45.3 |
52 |
658216 |
5427525 |
Keats |
| NFGC-25-GC-031 |
298 |
-45 |
47 |
658211 |
5427509 |
Keats |
| NFGC-25-GC-032 |
300 |
-45 |
54 |
658212 |
5427520 |
Keats |
| NFGC-25-GC-033 |
300 |
-45 |
43 |
658210 |
5427533 |
Keats |
| NFGC-25-GC-034 |
300 |
-45 |
24 |
658199 |
5427540 |
Keats |
| NFGC-25-GC-035 |
300 |
-45 |
37 |
658204 |
5427531 |
Keats |
| NFGC-25-GC-036 |
300 |
-45 |
21 |
658207 |
5427553 |
Keats |
| NFGC-25-GC-037 |
300 |
-45 |
40 |
658205 |
5427513 |
Keats |
| NFGC-25-GC-038 |
300 |
-45 |
40 |
658203 |
5427525 |
Keats |
| NFGC-25-GC-039 |
300 |
-45 |
40 |
658229 |
5427540 |
Keats |
| NFGC-25-GC-040 |
300 |
-45 |
25 |
658212 |
5427549 |
Keats |
| NFGC-25-GC-041 |
300 |
-45 |
33 |
658223 |
5427543 |
Keats |
| NFGC-25-GC-042 |
298 |
-45 |
36 |
658199 |
5427523 |
Keats |
| NFGC-25-GC-044 |
298 |
-45 |
37 |
658194 |
5427514 |
Keats |
| NFGC-25-GC-045 |
298 |
-45 |
28 |
658192 |
5427526 |
Keats |
| NFGC-25-GC-047 |
300 |
-45 |
42 |
658191 |
5427510 |
Keats |
| NFGC-25-GC-049 |
298 |
-45 |
21 |
658187 |
5427529 |
Keats |
| NFGC-25-GC-051 |
300 |
-45 |
39 |
658189 |
5427506 |
Keats |
| NFGC-25-GC-053 |
300 |
-45 |
33 |
658194 |
5427520 |
Keats |
| NFGC-25-GC-054 |
300 |
-45 |
33 |
658182 |
5427507 |
Keats |
| NFGC-25-GC-057 |
300 |
-45 |
45 |
658204 |
5427519 |
Keats |
| NFGC-25-GC-077 |
300 |
-45 |
12 |
658168 |
5427524 |
Keats |
| NFGC-25-GC-114 |
300 |
-45 |
14 |
658253 |
5427538 |
Keats |
Sampling, Sub-sampling, and Laboratory
All drilling recovers HQ core. For deep holes, the core size may be reduced to NQ at depth. The drill core is split in half using a diamond saw or a hydraulic splitter for rare intersections with incompetent core.
A geologist examines the drill core and marks out the intervals to be sampled and the cutting line. Sample lengths are mostly 1.0 meter and adjusted to respect lithological and/or mineralogical contacts and isolate narrow (<1.0m) veins or other structures that may yield higher grades.
Technicians saw the core along the defined cutting line. One half of the core is kept as a witness sample and the other half is submitted for analysis. Individual sample bags are sealed and placed into totes, which are then sealed and marked with the contents.
New Found Gold has submitted samples for gold determination by PhotonAssay to ALS Canada Ltd. (‘ALS‘) since February 2024. ALS operates under a commercial contract with New Found Gold.
Drill core samples are shipped to ALS for sample preparation in Thunder Bay, Ontario. ALS does not currently have accreditation for the PhotonAssay method at their Thunder Bay, ON laboratory. They do however have ISO/IEC 17025 (2017) accreditation for gamma ray analysis of samples for gold at their Australian labs with this method, including the Canning Vale lab in Perth, WA.
Samples submitted to ALS beginning in February 2024 received gold analysis by photon assay whereby the entire sample is crushed to approximately 70% passing 2 mm mesh. The sample is then riffle split and transferred into jars. For ‘routine’ samples that do not have VG identified and are not within a mineralized zone, one (300-500g) jar is analyzed by photon assay. If the jar assays greater than 0.8 g/t, the remaining crushed material is weighed into multiple jars and submitted for photon assay.
For samples that have VG identified, the entire crushed sample is riffle split and weighed into multiple jars that are submitted for photon assay. The assays from all jars are combined on a weight-averaged basis.
Select samples prepared at ALS are also analyzed for a multi-element ICP package (ALS method code ME-ICP61) at ALS Vancouver.
Drill program design, Quality Assurance/Quality Control, and interpretation of results are performed by qualified persons employing a rigorous Quality Assurance/Quality Control program consistent with industry best practices. Standards and blanks account for a minimum of 10% of the samples in addition to the laboratory’s internal quality assurance programs.
Quality Control data are evaluated on receipt from the laboratories for failures. Appropriate action is taken if assay results for standards and blanks fall outside allowed tolerances. All results stated have passed New Found Gold’s quality control protocols.
New Found Gold’s quality control program also includes submission of the second half of the core for approximately 2% of the drilled intervals. In addition, approximately 1% of sample pulps for mineralized samples are submitted for re-analysis to a second ISO-accredited laboratory for check assays.
The Company does not recognize any factors of drilling, sampling, or recovery that could materially affect the accuracy or reliability of the assay data disclosed.
The assay data disclosed in this press release have been verified by the Company’s Qualified Person against the original assay certificates.
Qualified Person
The scientific and technical information disclosed in this press release was reviewed and approved by Melissa Render, P. Geo., President, and a Qualified Person as defined under National Instrument 43-101. Ms. Render consents to the publication of this press release by New Found Gold. Ms. Render certifies that this press release fairly and accurately represents the scientific and technical information that forms the basis for this press release.
About New Found Gold Corp.
New Found Gold is an emerging Canadian gold producer with assets in Newfoundland and Labrador, Canada. The Company holds a 100% interest in Queensway and owns the Hammerdown Operation, Pine Cove Operation and Nugget Pond Hydrometallurgical Gold Plant. The Company is currently focused on advancing Queensway to production and bringing the Hammerdown Operation into steady-state gold production.
In July 2025, the Company completed a PEA at Queensway (see New Found Gold press release dated July 21, 2025). Recent drilling continues to yield new discoveries along strike and down dip of known gold zones, pointing to the district-scale potential that covers a +110 km strike extent along two prospective fault zones at Queensway.
New Found Gold has a new board of directors and management team and a solid shareholder base which includes cornerstone investor Eric Sprott. The Company is focused on growth and value creation.
Keith Boyle, P.Eng.
Chief Executive Officer
New Found Gold Corp.
Contact
For further information on New Found Gold, please visit the Company’s website at www.newfoundgold.ca, contact us through our investor inquiry form at https://newfoundgold.ca/contact/contact-us/ or contact:
Fiona Childe, Ph.D., P.Geo.
Vice President, Communications and Corporate Development
Phone: +1 (416) 910-4653
Email: contact@newfoundgold.ca
Follow us on social media at
https://www.linkedin.com/company/newfound-gold-corp
https://x.com/newfoundgold
Neither the TSXV nor its Regulation Services Provider (as that term is defined in the policies of the TSXV) accepts responsibility for the adequacy or accuracy of this release.
Forward-Looking Statement Cautions
This press release contains certain ‘forward-looking statements’ within the meaning of Canadian securities legislation, including relating to the current drill program on its Queensway Gold Project in Newfoundland and Labrador, Canada, and the timing, results and interpretation and use of the drill results; future drill programs and the timing and focus thereof; the excavation program and the timing and results thereof; future exploration and the objectives and timing thereof, including future drilling and excavation; exploration, drilling and mineralization at Queensway; the extent of mineralization and the continuity of high-grade gold mineralization; the potential conversion of mineral resources; potential resource expansion; a mineral resource update and the timing thereof; focus on growth and value creation; and the merits of Queensway. Although the Company believes that such statements are reasonable, it can give no assurance that such expectations will prove to be correct. Forward-looking statements are statements that are not historical facts; they are generally, but not always, identified by the words ‘expects’, ‘plans’, ‘anticipates’, ‘believes’, ‘interpreted’, ‘intends’, ‘estimates’, ‘projects’, ‘aims’, ‘suggests’, ‘indicate’, ‘often’, ‘target’, ‘future’, ‘likely’, ‘pending’, ‘potential’, ‘encouraging’, ‘goal’, ‘objective’, ‘prospective’, ‘possibly’, ‘preliminary’, and similar expressions, or that events or conditions ‘will’, ‘would’, ‘may’, ‘can’, ‘could’ or ‘should’ occur, or are those statements, which, by their nature, refer to future events. The Company cautions that forward-looking statements are based on the beliefs, estimates and opinions of the Company’s management on the date the statements are made, and they involve a number of risks and uncertainties. Consequently, there can be no assurances that such statements will prove to be accurate and actual results and future events could differ materially from those anticipated in such statements. Except to the extent required by applicable securities laws and the policies of the TSXV, the Company undertakes no obligation to update these forward-looking statements if management’s beliefs, estimates or opinions, or other factors, should change. Factors that could cause future results to differ materially from those anticipated in these forward-looking statements include risks associated with the Company’s ability to complete exploration and drilling programs as expected, possible accidents and other risks associated with mineral exploration operations, the risk that the Company will encounter unanticipated geological factors, risks associated with the interpretation of exploration results and the results of the metallurgical testing program, the possibility that the Company may not be able to secure permitting and other governmental clearances necessary to carry out the Company’s exploration plans, the risk that the Company will not be able to raise sufficient funds to carry out its business plans, and the risk of political uncertainties and regulatory or legal changes that might interfere with the Company’s business and prospects. The reader is urged to refer to the Company’s Annual Information Form and Management’s Discussion and Analysis, publicly available through the Canadian Securities Administrators’ System for Electronic Document Analysis and Retrieval (SEDAR+) at www.sedarplus.ca for a more complete discussion of such risk factors and their potential effects.
1 g/t Au= grams of gold per tonne
2 m = metres

To view the source version of this press release, please visit https://www.newsfilecorp.com/release/282330












 to ALS Canada Ltd. (‘ALS‘) since February 2024. ALS operates under a commercial contract with New Found Gold.


