Category

Investing

Category

Mark O’Byrne, managing director at Tara Coins, shares his outlook for gold and silver.

He sees much higher prices long term and expects gold to rise to at least US$10,000 per ounce; for silver, O’Byrne believes US$100 to US$150 per ounce is a ‘conservative’ target.

Securities Disclosure: I, Charlotte McLeod, hold no direct investment interest in any company mentioned in this article.

This post appeared first on investingnews.com

Silver is a notoriously volatile metal capable of wide price swings in either direction. However, the metal is also seen by many as a safe-haven investment and a hedge against inflation.

While investing in silver bullion is one popular method for gaining exposure, silver-mining companies offer another route.

Silver-mining companies with strong balance sheets and experienced management teams are able to capitalize on high silver prices and weather the storm of low silver prices. Some of the most profitable silver-mining companies are even able to offer investors dividends, which may be appealing for those who are in it for the long haul.

Dividends are especially attractive in the often-unstable mining sector because they give investors a degree of security — if a company pays a dividend, it generally feels that it has the cash to do so and believes it will have the ongoing profits it needs to keep those payments coming.

There are several dividend-paying silver stocks for investors to choose from. The companies below are ordered by dividend yield, and all data is current as of June 19, 2025.

1. Fresnillo (LSE:FRES,OTC Pink:FNLPF)

LSE market cap: GBP 10.66 billion
Dividend yield: 1.71 percent

Major miner Fresnillo bills itself as the world’s leading primary silver producer and a significant gold producer. Its precious metals operations are all located in Mexico, including the Fresnillo mine, which is the largest primary silver mine in the world. It also holds a portfolio of exploration prospects in the country and silver streaming contracts.

Fresnillo’s attributable output from its mines for the full 2024 year came to 56.3 million ounces of silver and 610,646 ounces of gold. The company’s reported mine production for the the first quarter of 2025 comes to 12.4 million ounces of silver and 156,100 ounces of gold.

Dividends from the company are paid in pounds sterling unless shareholders elect to be paid in US dollars. This silver stock pays two dividends per year, with the dividend split unevenly between the two; one third is paid in the interim dividend and two-thirds in the final dividend. Its dividend policy takes business profitability and underlying earnings growth into account, as well as capital requirements and cash flow.

Most recently, Fresnillo paid its 2024 final dividend of 19.6521 pence, or US$0.261, on May 30, 2025. Additionally, due to its 2024 financial performance, including revenue growth of 26.9 percent, the company paid a special one-off dividend of 31.4736 pence, or US$0.418 per share, the same day. This made 2024 Fresnillo’s highest recorded dividend payout year yet.

2. Pan American Silver (TSX:PAAS,NYSE:PAAS)

TSX market cap: C$14.39 billion
NYSE market cap: US$10.55 billion
Dividend yield: 1.41 percent

Founded by Ross Beaty in 1994, Pan American Silver currently operates four primary silver mines, which are located in Mexico, Peru, Bolivia and Argentina. It also has a portfolio of gold mines produce silver as a by-product.

The company’s 2024 silver production came in at 21.1 million ounces alongside 892,000 ounces of gold. For Q1 this year, output reached a total of 5 million ounces of silver and 182,200 ounces of gold.

In May, Pan American announced a definitive agreement to acquire silver producer MAG Silver (TSX:MAG,NYSEAMERICAN:MAG), which owns a 44 percent interest in the large-scale, high-grade Juanicipio mine, operated by Fresnillo.

The highest dividend Pan American has ever paid is US$0.125 per share, and it was able to pay a dividend of that amount a noteworthy nine times in a row between March 18, 2013, and March 13, 2015. The silver stock paid its most recent quarterly dividend on June 2, 2025, at US$0.10 per share.

3. Wheaton Precious Metals (TSX:WPM,NYSE:WPM)

TSX market cap: C$56.63 billion
NYSE market cap: US$41.58 billion
Dividend yield: 0.71 percent

Wheaton Precious Metals is a well-known name in the silver space largely because of its business model — it is the world’s biggest precious metals streaming company.

Streaming companies operate differently from miners, making upfront payments to a variety of metals companies in order to gain the right to purchase all or a portion of their metal production at a low, fixed cost.

The company currently has streaming agreements in place for 18 operating mines and 28 development-stage projects. It is interested in companies operating in politically stable jurisdictions, and states that its value should rise with the price of silver and gold. As a result, Wheaton sees itself offering investors multiple benefits while reducing many of the downside risks that traditional miners face.

Wheaton pays a quarterly dividend. So far in 2025, it has already made two dividend payments of US$0.165 per share, with the latest payment on June 10, 2025.

4. Silvercorp Metals (TSX:SVM)

TSX market cap: C$1.29 billion
NYSE market cap: US$950.85 million
Dividend yield: 0.59 percent

Silvercorp Metals operates the Gaocheng and Ying silver-mining operations in China, and is also focused on acquiring and growing underdeveloped projects with high upside.

Its silver production for its 2025 fiscal year ended March 31 came in at approximately 6.95 million ounces, and the company also produced 7,495 ounces of gold. The company’s 2026 production guidance is set at 7.38 million to 7.6 million ounces of silver and 9,100 to 10,400 ounces of gold.

Silvercorp offers shareholders a semiannual dividend, which it states is “based on a number of factors including commodity prices, market conditions, financial results, cash flows from operations, expected cash requirements and other relevant factors.” Its most recent dividend was paid on June 26, 2025, at a rate of US$0.0125 per share.

5. Hecla Mining Company (NYSE:HL)

NYSE market cap: US$3.76 billion
Dividend yield: 0.59 percent

Last on this list of silver stocks that pay dividends is Hecla Mining Company, which wholly owns and operates four mines and has a large exploration portfolio. The oldest precious metals miner in North America, Hecla is also the largest primary silver producer in the US and Canada and the third largest in the world.

In the US, Hecla operates the Greens Creek and Lucky Friday silver mines, located in Alaska and Idaho respectively. As for Canada, Hecla has the Keno Hill silver mine in the Yukon’s Keno Hill silver district, which is home to some of the world’s highest silver grades, as well as the Casa Berardi gold-silver mine in Québec.

Hecla reported 2024 production of 16.2 million ounces of silver, the second highest in the company’s history, and 142,000 ounces of gold. As for Q1 2025, the company produced 4.1 million ounces of silver and 34,242 ounces of gold.

Hecla pays an annual minimum common stock dividend, distributing it on a quarterly basis. Its dividends previously included a silver-linked component, but the company removed this in February 2025 in part to refocus the capital on growth opportunities.

Currently, the company’s annual minimum common stock dividend is set at US$0.015 per share, divided into quarterly payments of US$0.00375. Its most recent payment was on June 10, 2025.

Hecla also pays a quarterly US$0.875 per share dividend for its Series B cumulative convertible preferred stock, which it states is typically paid on January 1, April 1, July 1 and October 1.

FAQs for silver dividend stocks

What are dividend stocks?

Dividend stocks regularly pay a sum of money to a class of shareholders out of the company’s earnings. To qualify for a dividend payout, an investor must have owned the stock on the ex-dividend date.

Dividends are often issued as cash payments sent to a shareholder’s brokerage account, but can also be issued as stock or discounts on share purchases.

How to invest in dividend stocks?

You can invest in dividend-paying stocks through a stock broker or stock platform, and a stock broker can offer advice on how to take advantage of companies offering dividend programs. Some dividend stocks may also offer a dividend reinvestment program, allowing shareholders to automatically buy new shares with their dividends, either commission-free or at a reduced cost.

How much do dividend stocks pay?

A company’s board of directors is responsible for setting a dividend policy and will determine the size of the dividend payout based on the firm’s long-term revenue outlook.

The size of an individual shareholder’s dividend payout depends on the number of shares owned in that company. For example, if an investor owned 1,000 shares of Wheaton Precious Metals, which is currently paying a dividend of US$0.165 per share, they would get US$165 every quarter, totaling US$660 annually.

What silver ETFs pay dividends?

There are no physical backed Silver ETFs with dividends. However, ETFs that track dividend-paying silver stocks such as those listed above may offer the potential for dividend income. A few examples of are Global X Silver Miners ETF (ARCA:SIL), and iShares MSCI Global Silver and Metals Miners ETF (BATS:SLVP).

Securities Disclosure: I, Melissa Pistilli, hold no direct investment interest in any company mentioned in this article.

This post appeared first on investingnews.com

Investor Insight

With a fully permitted, high-grade gold project, established infrastructure and first gold production on the horizon, Maritime Resources is set to become Atlantic Canada’s next gold producer, positioning the company for significant re-rating and long-term growth.

Overview

Maritime Resources (TSX:MAE) is a Canadian gold development company focused on generating near-term cash flow from the Hammerdown gold project, a high-grade past-producer in the prolific Baie Verte mining district of Newfoundland & Labrador. The project is fully permitted, de-risked and shovel-ready, with construction underway and first ore deliveries to the Pine Cove Mill expected in late summer to early fall 2025.

Hammerdown project site

Hammerdown benefits from significant infrastructure synergies, including proximity to paved roads, power, ports and Maritime’s wholly owned Pine Cove processing facility. Unlike many greenfield developers, Maritime is executing a bootstrap production model that leverages its installed infrastructure and local skilled labor to reduce costs, minimize risk and accelerate value creation through short term cash flow generation during a period of record high gold prices

Longer term, the company plans to build out a 100,000 oz/year production platform by incorporating nearby deposits (Orion, Stoger Tight, Deer Cove) and utilizing its idle 700 tpd Nugget Pond gold plant. Maritime’s regional land package includes more than 435 sq km of highly prospective ground with gold, VMS, and porphyry-style mineralization potential.

Company Highlights

  • Near-term Gold Production: First production targeted for H2/2025 from the fully permitted Hammerdown open pit project.
  • High-grade Gold Reserves: 1.9 Mt at 4.46 g/t gold (272 koz) proven and probable reserves support initial 35,000-45,000 oz/year production.
  • Low-CAPEX Startup: Initial capital estimated at C$15 to $20 million, among the lowest in the sector for a new mine, leveraging Maritime’s fully operational Pine Cove mill
  • Owned Processing Infrastructure: Pine Cove Mill (1,300 tpd, operational) and the Nugget Pond gold plant (700 tpd CIP circuit, on standby).
  • Exploration Upside: 435 sq km land package includes multiple brownfield and greenfield targets proximal to infrastructure.
  • Institutional Backing: Strong support from Dundee Corporation, Eric Sprott and other institutions.
  • Local Workforce Advantage: Fully staffed Pine Cove Mill with 100 percent local residents

Key Projects

Hammerdown Gold Project

The Hammerdown gold project is Maritime’s flagship asset and is strategically located near the town of King’s Point in the Baie Verte mining district of Newfoundland and Labrador. A past-producing, high-grade deposit formerly operated by Richmont Mines, Hammerdown is being redeveloped as a shallow open-pit operation. The project hosts proven and probable reserves of 1.89 million tonnes at an average grade of 4.46 grams per ton (g/t) gold for 272,000 oz of contained gold, making it one of the highest grade open pit projects in North America

A feasibility study completed in 2022 outlined annual production of approximately 50,000 oz over a 5-year mine life, with attractive economics including a pre-tax NPV (5 percent) of US$251 million at a gold price of US$2,500/oz and an all-in sustaining cost (AISC) of US$912/oz. Since then Maritime has taken steps to de-risk the project including acquiring the Pine Cove mill, allowing for significant savings in capital costs compared to using the Nugget Pond mill.

The processing plan entails crushing ore on site and trucking it approximately 130 km to the Pine Cove Mill. Maritime has completed all major permitting for the project, and construction began in spring 2025 with pre-stripping, civil works and crushing infrastructure installation. The company completed more than 8,750 meters of tight-spaced (10×10 meters) grade control drilling, confirming excellent continuity and high-grade intercepts such as 24.5 g/t gold over 13.9 meters, including 42.2 g/t over 8.0 meters. First gold production is expected in late summer to early fall 2025, with ramp-up to 700 tpd mill feed supported by the fully operational Pine Cove Mill.

Pine Cove Mill

Pine Cove gold pour

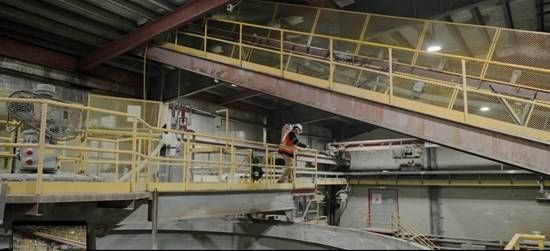
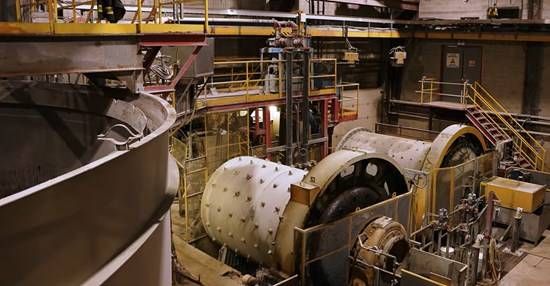
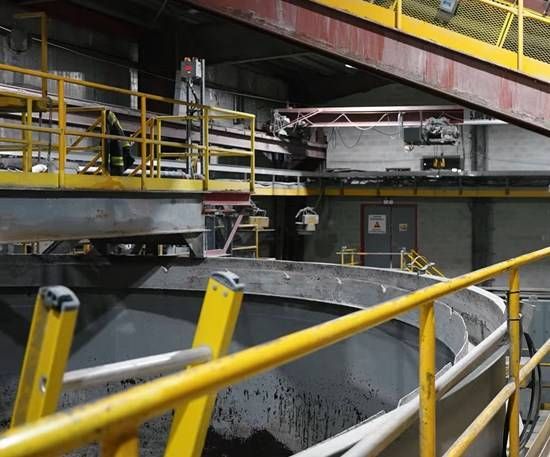
Located near Baie Verte, the Pine Cove Mill is a 1,300-ton-per-day gold processing facility recently brought back online after two years of care and maintenance. The mill flowsheet includes crushing, grinding, flotation, regrinding of the float concentrate and Merrill-Crowe leaching circuits for gold doré production. The facility will be upgraded with a new 500 hp regrind circuit (replacing a 150 hp unit), a ball mill inching drive, and an enhanced material handling system to optimize recovery and reliability. The site also includes a large in-pit tailings storage facility, existing waste dump capacity, and access to a deepwater port. Pine Cove has already produced 700oz of gold from processing low grade mineralized stockpiles from around the site. The mill is now preparing to receive and process feed from Hammerdown, with full integration scheduled for H2/2025.

Nugget Pond Gold Circuit

Nugget Pond Gold Circuit

Maritime also owns the 700 tpd carbon-in-pulp (CIP) gold circuit at the Nugget Pond Plant, located 40 km east of Pine Cove. Although currently idle, this plant represents a key component of Maritime’s long-term production strategy to scale toward 100,000 oz per year. The plant is fully configured for gold recovery and is well-positioned to process feed from future regional deposits or third-party toll milling. Maritime’s envisions Nugget Pond operating as a second production hub, enabling parallel processing capacity as the company develops additional deposits in the district.

Stoger Tight and Deer Cove Projects

Located within 10 km of the Pine Cove Mill, Stoger Tight and Deer Cove are advanced-stage deposits with near-term development potential. Stoger Tight hosts a historical NI 43-101 resource of 642,000 tons grading 3.02 g/t gold for 62,300 oz (indicated), with an additional 53,000 tons at 5.63 g/t for 9,600 oz (inferred). It is partially permitted and has the potential to become a satellite source of ore for Pine Cove.

Deer Cove is a high-grade system discovered by Noranda, featuring 500 meters of historic underground development. Recent drill results include 6.9 g/t over 25.1 meters, including 26.1 g/t over 3.6 meters. Stockpiles of 4,275 tons at 3.1 g/t gold have been identified. Both projects benefit from road access and proximity to infrastructure, making them ideal candidates for phased development and integration into Maritime’s hub-and-spoke production model.

Green Bay, Whisker Valley and El Strato Exploration Projects

Maritime’s broader exploration portfolio includes more than 435 sq km of prospective ground in the Baie Verte district, encompassing gold, copper, VMS and porphyry-style targets. The Green Bay project includes the Orion deposit, a near-surface gold target located along strike from Hammerdown. Whisker Valley is an epithermal gold system with porphyry potential, returning 6.2 g/t gold over 5.8 meters in previous drilling. El Strato hosts one of the highest-grade soil and bedrock anomalies in Newfoundland, with gold values up to 200 g/t in outcrop. Additionally, the Black Ridge VMS target features grab samples grading up to 12.6 g/t gold, 181 g/t silver, and 11.8 percent copper. These regional assets offer significant blue-sky potential and provide a robust pipeline of targets that could be developed and processed through Maritime’s existing infrastructure.

Management Team

Garett Macdonald – President and CEO

Garett Macdonald is a mining engineer with over 30 years of experience in mine development, engineering and operations. Former VP operations at Rainy River Resources, where he advanced the 8 Moz Rainy River project to construction prior to its $310-million sale to New Gold. He also served as VP project development at JDS Mining, leading the Curraghinalt feasibility study (+5 Moz gold), and held technical and management roles at Placer Dome, Teck and Suncor Energy.

Germaine M. Coombs – CFO and Corporate Secretary

A chartered accountant with more than three decades of financial leadership in the mining sector, Germaine M. Coombs is the former CFO of Aurelius Minerals and Stonegate Agricom, and former corporate controller at FNX Mining and the Iron Ore Company of Canada.

Perry Blanchard – VP, Environment & Sustainability

Perry Blanchard brings over 25 years of experience in health, safety and environmental leadership across major Canadian mining projects. Blanchard previously managed permitting and sustainability at Detour Gold’s flagship mine and Vale’s Voisey’s Bay operations.

Peter Goudie – Hammerdown Operations Manager

Peter Goudie is a veteran operations leader with over 35 years of experience in mining and contracting, including roles with Guy J. Bailey and Shoreline Aggregates. He manages day-to-day operations at the Hammerdown project, with deep knowledge of logistics, mobile equipment and site execution in Newfoundland’s mining sector.

Dwight Goudie – Pine Cove Mill Manager

Dwight Goudies is a mill operations specialist with over 40 years of metallurgical and processing experience at gold and base metal mines across Newfoundland and Labrador. He is the former mill manager at FireFly Metals and Rambler Metals & Mining’s Nugget Pond facility, and currently oversees all operations at the Pine Cove Mill.

Billy Grace – Chief Engineer

A mining engineer with more than 15 years of experience in mine engineering, project management and consulting, Billy Grace is the former general manager at Aureus Gold, and technical services manager at Newmont’s Musselwhite mine. He also worked at Golder Associates and Mining Plus.

Larry Pilgrim – Project Manager, Newfoundland Properties

Larry Pilgrim is an exploration geologist with more than 45 years of experience in Newfoundland. He is the former chief geologist at Richmont Mines and Rambler Metals, where he helped delineate the original underground reserves at Hammerdown and served as chief geologist during mine operations. He has been leading exploration activities for Maritime since 2018.

Eric Tremblay – Technical Advisor Mining

Eric Tremblay is a highly regarded mine builder with over 30 years of operations experience. He is the former GM at Osisko’s Canadian Malartic Mine and IAMGOLD’s Westwood and Sleeping Giant operations. Tremblay is currently the COO of Dalradian Resources, leading the multi-million ounce Curraghinalt gold project in Northern Ireland. Tremblay provides Maritime with expertise in mine construction, operational scale-up and technical risk management.

Paolo Toscano – Technical Advisor Engineering and Construction

Paolo Toscano has over 30 years of experience in engineering and construction. He most recently served as senior vice-president of engineering and construction for Calibre Mining at the Valentine gold project in Newfoundland and Labrador. Prior to Calibre, he was director of projects for Alamos Gold and New Gold.

This post appeared first on investingnews.com

Sranan Gold Corp. (CSE: SRAN) (FSE: P84) (Tradegate: P84) (‘Sranan’ or the ‘Company’) announces updates on activities related to the upcoming drilling campaign at the Tapanahony Project in Suriname. The geological, logistical support and drill teams are on site and actively engaged in drilling-related activities.

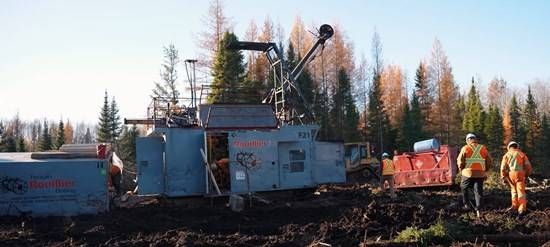
The construction of camp infrastructure, core logging and storage facilities is nearing completion. Two drills acquired by Sranan, as well as downhole equipment, have arrived on site in preparation for imminent drilling.

Sranan recently discovered new mining activity by local miners on strike of Randy’s Pit. This mining will assist in identifying further priority targets for drilling.

At the Randy’s Pit target on the southern end of the 4.5-kilometer trend, initial drill sites have been selected for up to 6,000 metres of drilling, and drill pads are being prepared by excavator.

At a later date, drilling will commence on the north side of the Tapanahony River once further evaluation including trenching is completed, and continuing mapping and sampling of active mining is used to select drill sites.

Mapping and results are being recorded and integrated into Rogue software to enable rapid evaluation. This software will also serve as the foundation for core logging and sampling activities. Established procedures are currently in place and undergoing review.

Each of the target areas has been identified by a combination Lidar survey, geophysics, geological interpretation, exploration data from previous operators, fieldwork, and most importantly, local mining activity. The areas currently identified are referred to as Randy’s Pit, Randy’s Extension, Randy West, Poeketi Pit, West Poeketi, South Intrusion, Enard North and Enard South (see Sranan’s news release dated June 16, 2025 for more information).

Cannot view this image? Visit: https://images.newsfilecorp.com/files/10997/258198_4ca4346d2424c9fa_001.jpg

Figure 1: Location of Randy and Poeketi trends at the Tapanahony Project.

To view an enhanced version of this graphic, please visit:
https://images.newsfilecorp.com/files/10997/258198_4ca4346d2424c9fa_001full.jpg

Cannot view this image? Visit: https://images.newsfilecorp.com/files/10997/258198_4ca4346d2424c9fa_002.jpg

Figure 2: Unloading camp and drill supplies at the Tapanahony Project.

To view an enhanced version of this graphic, please visit:
https://images.newsfilecorp.com/files/10997/258198_4ca4346d2424c9fa_002full.jpg

Stock Option Update

Further to its news release dated June 27, 2025, the Company wishes to confirm that it has granted a total of 4,300,000 stock options to certain directors, officers and/or consultants at an exercise price C$0.53 per share, expiring June 24, 2030.

Qualified Person

Dr. Dennis J. LaPoint, Ph.D., P.Geo. a ‘qualified person’ as defined under National Instrument 43‐101, has reviewed and approved the scientific and technical information in this release. Dr. LaPoint is not independent of Sranan Gold, as he is the Company’s EVP Exploration and Corporate Development.

About Sranan Gold 

Sranan Gold Corp. is engaged in the business of mineral exploration and the acquisition of mineral property assets in Suriname. The highly prospective Tapanahony Project is located in the heart of Suriname’s modern-day gold rush. Tapanahony covers 29,000 hectares in one of the oldest and largest small-scale mining areas in Suriname. There is significant production from saprolite by local miners along a 4.5-kilometre trend, where several areas of mining have been opened.

Sranan Gold is also exploring its Aida Property consisting of five mineral claims covering an area of 2,335.42 hectares on the Shuswap Highland within the Kamloops Mining Division.

For more information, visit sranangold.com.

Information contact
Oscar Louzada, CEO
+31 6 25438975

THE CANADIAN SECURITIES EXCHANGE HAS NOT APPROVED NOR DISAPPROVED THE CONTENT OF THIS PRESS RELEASE.

Forward-Looking Statements

Certain statements in this release constitute ‘forward-looking statements’ or ‘forward-looking information’ within the meaning of applicable securities laws including, without limitation, the timing, nature, scope and details regarding the Company’s exploration plans and results at its projects. Such statements and information involve known and unknown risks, uncertainties and other factors that may cause the actual results, performance or achievements of the Company, its projects, or industry results, to be materially different from any future results, performance or achievements expressed or implied by such forward-looking statements or information. Such statements can be identified by the use of words such as ‘may’, ‘would’, ‘could’, ‘will’, ‘intend’, ‘expect’, ‘believe’, ‘plan’, ‘anticipate’, ‘estimate’, ‘scheduled’, ‘forecast’, ‘predict’ and other similar terminology, or state that certain actions, events or results ‘may’, ‘could’, ‘would’, ‘might’ or ‘will’ be taken, occur or be achieved. These statements reflect the company’s current expectations regarding future events, performance and results and speak only as of the date of this release. Further details about the risks applicable to the Company are contained in the Company’s public filings available on SEDAR+ (www.sedarplus.ca), under the Company’s profile.

Forward-looking statements and information contained herein are based on certain factors and assumptions regarding, among other things, the estimation of mineral resources and reserves, the realization of resource and reserve estimates, metal prices, taxation, the estimation, timing and amount of future exploration and development, capital and operating costs, the availability of financing, the receipt of regulatory approvals, environmental risks, title disputes and other matters. While the Company considers its assumptions to be reasonable as of the date hereof, forward-looking statements and information are not guarantees of future performance and readers should not place undue importance on such statements as actual events and results may differ materially from those described herein. The Company does not undertake to update any forward-looking statements or information except as may be required by applicable securities laws.

Corporate Logo

To view the source version of this press release, please visit https://www.newsfilecorp.com/release/258198

News Provided by Newsfile via QuoteMedia

This post appeared first on investingnews.com

Investor Insight

Triumph Gold offers investors exposure to a multi-million ounce gold resource base with established deposits, significant expansion potential, and new discovery opportunities across a true district-scale land package, all strategically positioned in the mining-friendly Yukon.

Overview

Triumph Gold (TSXV:TIG,OTC:TIGCF) is a Canadian gold exploration company strategically positioned to capitalize on the rising gold market. The company is primarily focused on advancing its 100 percent owned Freegold Mountain project, a district-scale property located in the Yukon Territory’s prolific Dawson Range gold-copper belt.

Founded with a vision to discover and develop significant precious metal resources, Triumph Gold has assembled a portfolio centered around its flagship Freegold Mountain project. With over 20 mineralized zones identified along a 34 km stretch of the Big Creek Fault system, the company possesses significant exploration upside with established resources across multiple deposits. The project benefits from excellent infrastructure, being accessible via all-weather government roads, which provides cost advantages compared to more remote exploration projects.

The Yukon Territory has a storied history as one of the world’s most famous gold jurisdictions, dating back to the legendary Klondike Gold Rush of the late 1890s that drew over 100,000 prospectors to the region. Today, the territory continues to be recognized as one of the world’s premier exploration destinations, hosting world-class deposits like Victoria Gold’s Eagle mine (3.3 million ounces), Western Copper’s Casino project (8.9 million ounces gold, 4.5 billion pounds copper), and Newmont’s Coffee project (4 million ounces).

The Yukon government has consistently demonstrated strong support for responsible mining development. The territory offers a stable regulatory environment, clear permitting processes, and collaborative relationships with First Nations, making it an attractive jurisdiction for resource development. Additionally, the Yukon Resource Gateway Project, a $360 million infrastructure initiative, continues to improve access to mineral-rich areas throughout the territory.

With geopolitical tensions, inflationary pressures, and currency devaluation concerns driving investor interest in safe-haven assets, gold exploration companies with substantial resource potential like Triumph Gold are well-positioned to benefit from this strengthening market cycle.

Company Highlights

  • Resource Base: Combined indicated resources of 1 million ounces and inferred resources of 1.08 million ounces gold equivalent across the Freegold Mountain project
  • Strategic Location: Positioned in the mineral-rich Dawson Range, home to major deposits including Newmont’s Coffee, Western Copper’s Casino, and Pembridge’s Minto mine
  • Multiple Deposit Types: Mineralization found in various forms (porphyry, epithermal, skarn) providing diversified exploration targets
  • Expansion Potential: All deposits remain open in multiple directions with numerous untested satellite targets
  • Fully Permitted: Exploration permits in place until 2025-2026 allowing for extensive drilling programs
  • Experienced Leadership: Management team with proven track records in mineral exploration, mine development and capital markets

Key Projects

Freegold Mountain Project

Map of Triumph Gold

The Freegold Mountain project represents Triumph Gold’s flagship asset – a district-scale property that spans 34 kilometers along the prolific Big Creek Fault mineralization system in the Yukon. What makes this project particularly compelling is the presence of mineralization in every rock type across the property, including Paleozoic metamorphics, Jurassic intrusives and Cretaceous intrusives, each hosting different styles of precious and base metal deposits.

The project currently hosts three defined deposits – Nucleus, Revenue and Tinta Hill – with a combined resource of more than 2 million ounces of gold equivalent. What’s particularly exciting about Freegold Mountain is that these deposits represent just a fraction of the more than 20 mineralized zones identified across the property. With extensive permitted exploration programs, ongoing geological work, and vast untested areas, Freegold Mountain exemplifies true district-scale potential where new discoveries could substantially increase the overall resource base.

Nucleus Deposit

Triumph Gold

The Nucleus deposit represents a compelling bulk tonnage oxide gold opportunity with similarities to Victoria Gold’s Eagle mine. With indicated resources of 748,000 ounces gold equivalent and inferred resources of 189,000 ounces gold equivalent, the deposit features favorable metallurgy with approximately 77 percent cyanide recoverable gold based on preliminary testing. Recent drilling has expanded the resource by 50 to 100 meters both laterally and vertically, with mineralization remaining open in all directions. Drilling has also confirmed significant oxide mineralization extending up to 150 meters vertically, enhancing the potential for heap leach processing.

Revenue Deposit

The Revenue deposit is a substantial porphyry system with indicated resources of 252,000 ounces and inferred resources of 677,000 ounces gold equivalent. It shows similarities to Western Copper’s Casino deposit but with double the gold grade. The deposit contains multiple high-grade zones including the Blue Sky and WAu zones, which were expanded through recent drilling programs. The company has identified a more than 5 km structural trend connecting various mineralized zones, suggesting significant resource expansion potential. Geophysical and geochemical surveys have identified numerous untested anomalies worth exploring.

Casino Mill resource at Triumph Gold

Revenue – Casino deposits comparison

Tinta Hill Deposit

Resource at Triumph Gold

With inferred resources of 216,000 ounces gold equivalent, Tinta Hill is a polymetallic deposit with substantial gold, silver, copper, lead and zinc values. The property has historical underground development including two adits with extensive drifting completed in 1980-1981. There’s a 25,000-ton stockpile from previous mining operations that could represent near-term cash flow potential. The deposit remains open along strike and at depth, with opportunities to extend mineralization through additional IP and ground magnetic surveys.

Exploration Properties

Beyond the three established deposits, Triumph Gold holds several promising early-stage exploration targets across the Freegold Mountain Project and beyond, including:

  • Melissa Zone: A drill-ready target with similarities to the Nucleus deposit, featuring anomalous gold in rock samples and coincident multi-element soil and geophysical anomalies
  • Tad/Toro-Big Creek: Located approximately 50 km southeast of the Casino deposit, showing intermediate sulfidation epithermal and porphyry-style mineralization across multiple zones
  • Andalusite Peak: A copper-gold-silver porphyry target with three separate mineralized zones showing high-grade rock samples up to 68 percent copper, 2.77 grams per ton (g/t) gold, and 526 g/t silver

Coyote Knoll Silver-Gold Project

Triumph Gold

Located in central Utah, Coyote-Knoll is Triumph Gold’s most recent acquisition. It is approximately 40 km southwest of the prolific Tintic mining district, known for its rich mining history, with gold, silver, lead and zinc from both epithermal and carbonate replacement deposits. The Bingham Canyon copper-molybdenim-gold porphyry deposit is about 85 km away.

Following its discovery in 1988, Coyote Knoll underwent exploration work, including mapping, trenching, rock sampling, and induced polarization and magnetic geophysical surveys. Approximately 2,600 metres of RC drilling have been completed at the property to date, with compelling results including 1,350.36 g/t silver and 3.86 g/t gold over 3 metres. Historical rock samples returned high-grade silver and gold values, up to 6,730 g/t silver and 23.30 g/t gold, and 6,687.08 g/t silver and 26.37 g/t gold.

u200bHistoric drilling highlights at Coyote Knoll

Historic drilling highlights at Coyote Knoll

A 12-ton representative bulk sample was also mined from a shallow open pit, centered over the east-west trending mineralized structure. Silver and gold epithermal mineralization was exposed over approximately 60 metres within the open pit and has been delineated for 1.5 km through surface trenching, sampling and shallow RC drilling.

Management Team

John Anderson – Interim CEO and Chairman

With over 20 years of experience in resource sector capital marketing, John Anderson brings strategic vision to company growth and management. His extensive background in capital formation and corporate development provides Triumph Gold with strong leadership as it advances its portfolio of projects.

Brian Bower – Lead Director

Brian Bower contributes 30 years of experience in exploration and mining to the Triumph Gold team. He has been a key member in the development of several significant mining projects including New Afton, Kemess South, Blackwater, Mount Milligan mines and the Casino deposit, bringing valuable technical and operational insights to the company’s development strategies.

Jesse Halle – VP Exploration

With more than 25 years of experience in mineral exploration, Jesse Halle has specialized in advancing multiple porphyry copper-gold deposits in Yukon and British Columbia. His extensive work with similar deposits, including the Casino and Copper Mountain deposits, brings critical technical expertise to Triumph’s exploration programs.

Marty Henning – Principal Geologist

Marty Henning contributes over 15 years of mineral exploration and mining experience to the team. His background includes focused work on construction, production and exploration at the New Afton block cave mine, providing valuable operational perspective to Triumph’s exploration approach.

Graeme Hopkins – Chief Technical Officer

With 20 years of experience in data management and GIS, Graeme Hopkins has been involved with the Freegold Mountain project since 2008. His long-term knowledge of the project and technical expertise provides valuable continuity and insight to Triumph’s exploration and development activities.

Emily Halle – Project Manager

Emily Halle brings over 15 years of experience in exploration and project management to the team. Her focus on porphyry copper-gold systems in British Columbia and Yukon, combined with additional experience in South Africa, Alaska and Eastern Canada, ensures efficient and effective management of Triumph’s exploration programs.

This post appeared first on investingnews.com


C$532M After-Tax NPV5%, C$175M Initial Capital, Adjacent to Multiple Mills, Still Growing


Radisson Mining Resources Inc. (TSXV: RDS,RMRDF) (OTCQB: RMRDF) (‘Radisson’ or the ‘Company’) is pleased to announce a positive Preliminary Economic Assessment (the ‘PEA’) for the O’Brien Gold Project (‘O’Brien’ or the ‘Project’) located in the Abitibi region of Québec. Highlights are as follows (all figures are in Canadian dollars and troy ounces unless noted):


Basis of Study:


  • Assumes off-site toll milling based on the results of a recent milling assessment and metallurgical study that demonstrated the potential compatibility of the nearby Doyon gold mill, part of IAMGOLD Corporation’s (‘IAMGOLD‘) Westwood Mine Complex1. Off-site milling reduces capital costs, development risk, and project footprint.
  •  

  • Utilizes existing Mineral Resource Estimate (‘MRE‘), re-blocked with an updated cut-off yielding more ounces in more tonnes with good continuity at a lower average grade.
  •  

  • Presents a base case ‘snap-shot’ study that excludes recent drilling successes outside the existing MRE and below historic mine workings, with a 50-60,000 metre (m) fully funded drill program ongoing.
  •  

Value:


  • After-tax Net Present Value at a 5% discount rate (‘NPV5%‘) of $532 million (‘M’), Internal Rate of Return (‘IRR’) of 48%, and payback of 2.0 years at US$2,550/oz gold (‘Au’).
  •  

  • After-tax NPV5% of $871M, IRR of 74%, and payback of 1.1 years at US$3,300/oz Au.
  •  

Cost:


  • Initial Capital Cost (‘Capex’) of $175M and Life-of-Mine Sustaining Capital of $173M 
  •  

  • Cash Cost2 of US$861/oz and All-In Sustaining Cost1 (‘AISC’) of US$1,059/oz including conceptual 30% toll milling margin on processing and G&A costs.
  •   

Production Profile:


  • 11-Year Mine Life with 740 koz mined and 647 koz recovered at 87% average recovery with a gravity-flotation-regrind-leach flowsheet.
  •  

  •  70 koz/annum average steady-state gold production (Years 2-8) at an average annual after-tax Free Cash Flow (‘FCF’) of $97M.
  •  

  • Underground mining with long-hole stoping and minimal surface facilities.
  •  

Radisson will host a technical webinar on the O’Brien PEA on Wednesday July 9, 2025 at 11am ET (8am PT). Participants may register here. A recording will be available following the webinar.


Matt Manson, President & CEO, commented: ‘We are pleased to be reporting today the first modern mining study for the O’Brien Gold Project. This PEA builds upon the milling assessment completed earlier this year that demonstrated the potential viability of processing O’Brien mined material at a neighbouring mill. The result is a low cost and high value project should a beneficial milling arrangement be secured. By taking advantage of existing infrastructure in the region, the study surfaces considerable value for O’Brien while minimizing its environmental impact. The extremely high NPV5% to cost ratio demonstrates the efficient allocation of capital that this approach offers.


‘Rather than high-grading the deposit, as was the case with the historic O’Brien Mine, the PEA is developed from the existing MRE with a lower cut-off, yielding more ounces, more tonnes and better mining continuity at lower average grades. From that starting point, we are presenting a fully underground mine plan, right sized at 1,200 tonnes per day (‘tpd’) and optimized at a cautious US$2,000/oz gold price assumption, delivering 740,000 ounces of gold to the mill at high margins over an 11-year life. The O’Brien Gold Project’s legacy of high grades and visible gold continues to be an attribute of the current mine design and the ongoing exploration.’


Pierre Beaudoin, Chairman of the Board of Directors, commented: ‘The PEA announced today is a significant step forward for Radisson. The study outlines a credible mine plan and development strategy for O’Brien, offering shareholders significant value even on the existing mineral resources. This is also just a snap-shot of a project that is continuing to grow. The ongoing drill program is demonstrating impressive new gold mineralization outside the scope of this initial mine design. On the basis upon which the PEA is developed, we believe a significantly larger mineral inventory exists to our exploration horizon of 2,000 m depth. Recent drill results are supporting this thesis.’


Matt Manson continued: ‘We see in O’Brien a broad system of mineralization with significant scale potential. Our current focus at Radisson is to maximize this potential through the recently expanded drill program and our strong treasury. Today’s PEA, however, establishes a project development path that is practical and highly rewarding. We intend to further pursue this path with environmental baseline studies, additional engineering and mine plan optimization, community consultation, and dialog with potential processing partners.’


VIDEO: President & CEO Matt Manson comments on today’s news


O’Brien Gold Project Preliminary Economic Assessment


The PEA was completed by Ausenco Engineering Canada ULC (‘Ausenco’) as lead consultant with specific responsibility for metallurgy, processing design, infrastructure and financial modelling. InnovExplo (a member of Norda Stelo Inc.; ‘Norda Stelo’) completed the mine design and mine scheduling, BBA Inc. were responsible for water management, surface facilities, and a review of the Project’s environmental assessment procedure and permitting requirements, and SLR Consulting (Canada) Ltd. (‘SLR’) were responsible for the MRE.


The PEA is a companion study to a recently completed milling assessment for the Project in which a metallurgical program was conducted with representative samples of mineralized core from O’Brien. The samples were tested based on a series of flow sheet options which would conceptually be compatible with the nearby Doyon gold mill, part of IAMGOLD’s Westwood Mine Complex, with minimal adjustment to the existing Doyon mill configuration. The milling assessment was conducted under a Memorandum of Understanding (‘MOU‘) with IAMGOLD (Radisson news release dated September 9, 2024). The MOU is non-binding and non-exclusive and contains no specific terms around potential commercial arrangements between the parties. The PEA has been completed independently by Radisson and establishes criteria for the development of O’Brien based on processing and tailings management at an existing off-site facility under a toll milling arrangement.


Cautionary statement: Readers are cautioned that the PEA is preliminary in nature, it includes inferred mineral resources that are considered too speculative geologically to have economic considerations applied to them that would enable them to be categorized as mineral reserves, and there is no certainty that the PEA will be realized.


Table 1: Summary of Key Results and Assumptions in the PEA


 Production Datanote 1 Values Units
Life-of-Mine 11 Years
Total Resource Mined 4,575 kt
Total Waste Mined 3,314 kt
Average Head Grade 5.0 g/t Au
Contained Gold 740 koz
Recovered Gold 647 koz
Average Gold Recovery 87%
 Years 2-8: Steady State Run-Ratenote2 Average Production Mining Rate 1,160 tpd
Average Annual Gold Production 70 koz
Average Head Grade 4.9 g/t Au
Annual Average After-Tax Free Cash Flow $97 C$M
 Capital Costsnote 1 Values Units
Initial Capital $175 C$M
Sustaining Capital (Excluding Closure) $173 C$M
Capital Intensity (Initial Capital/oz milled) $172 US$/oz
 Life-of-Mine Operating Costsnotes 1,3 Values Units
Miningnote 3 $76 C$/t milled
Processing $38 C$/t milled
G&A $31 C$/t milled
30% Processing Toll note 4 $19 C$/t milled
Total Operating Cost $163 C$/t milled
Refining & Transport $6 US$/oz
Royalties $10 C$M
Total Cash Cost $861 US$/oz
All-In Sustaining Costnote 5 $1,059 US$/oz
 Financial Analysisnote 1 Values Units
Gold Price for Financial Analysis $2,550 US$/oz
US$:C$ Exchange $0.73
Pre-Tax NPV5% $782 C$M
Pre-Tax IRR 65%
Pre-Tax Payback 1.4 years
After-Tax NPV5% $532 C$M
After-Tax IRR 48%
After-Tax Payback 2.0 years
Mine Revenue $2,258 C$M
EBITDA $1,496 C$M
EBITDA Margin 66%
Pre-Tax Unlevered Free Cash Flow $1,146 C$M
After-Tax Unlevered Free Cash Flow $803 C$M


Notes: 


  1. Denotes a ‘specified financial measure’ within the meaning of NI 52-112. See note on ‘Non-IFRS Financial Measures’.
  2.  

  3. Represents full calendar years
  4.  

  5. LOM operating costs includes cash operating costs during the initial capital period. Mining operating costs exclude waste development costs and mobile equipment costs which are captured as sustaining capital items
  6.  

  7. Processing toll milling charges are conceptual and have been estimated by Ausenco based on recent industry precedent
  8.  

  9. AISC includes Royalties, Total Cash Costs and Sustaining Capital, including closure costs. Excludes corporate G&A.
  10.  

Mineral Resources


The MRE for the Project was originally disclosed in March 2023 (Radisson news release dated March 2, 2023) based on 325,509 m of drilling completed to the end of 2022 and authored by SLR. Indicated Mineral Resources were estimated at 0.50 million ounces (1.52 million tonnes at 10.26 g/t Au) with additional Inferred Mineral Resources of 0.45 million ounces (1.60 million tonnes at 8.66 g/t Au). The 2023 study utilized a 4.5 g/t Au cut-off at US$1,600/oz Au with certain assumptions for minimum mining width, mining costs, C$:US$ exchange and metallurgical recovery. Mineral Resources that are not Mineral Reserves do not have demonstrated economic viability.


For the purposes of the PEA, the 2023 block model was re-blocked by SLR in the Z-direction to 5 m to allow for more flexible underground mine design, and an updated cut-off and set of economic criteria were applied consistent with Deswick Stope Optimizer (‘DSO’) parameters used for the optimization of the underground mine schedule and the Project’s recent milling assessment. The MRE now utilizes a cut-off of 2.2 g/t Au at US$2,000/oz Au. No other changes were made. This has the effect of increasing tonnage and ounces and decreasing average grade compared to the previous estimate (Table 2).


Table 2: Mineral Resource Estimate Using a 2.2 g/t Au Cut-Off and US$2,000/oz Gold Price
(Numbers in Italics Represent Changes from the MRE based on a 4.5 g/t Au Cut-Off and US$1,600/oz Gold Price.)


Category Tonnes (kt) Grade (g/t Au) Oz (koz Au)
Indicated 2,204 +45% 8.2 -20% 582 +16%
Inferred 6,671 +317% 4.4 -50% 932 +109%


Notes: 


  1. Prepared in accordance with the Canadian Institute of Mining, Metallurgy and Petroleum (CIM) Definition Standards (2014) and Best Practice Guidelines of Mineral Resources and Reserves (2019).
  2.  

  3. Mineral Resources are reported above a cut-off grade of 2.2 g/t Au based on a C$172.5/t operating cost.
  4.  

  5. Mineral Resources are estimated using a long-term gold price of US$2,000/oz Au, a US$:C$ exchange rate of 1:1.33, and a metallurgical recovery of 90%.
  6.  

  7. Wireframes were modelled at a minimum width of 1.2 m.
  8.  

  9. Bulk density varies by deposit and lithology and ranges from 2.00 t/m³ to 2.82 t/m³.
  10.  

  11. Full length composites were capped 40 g/t Au.
  12.  

  13. Mineral Resources that are not Mineral Reserves do not have demonstrated economic viability.
  14.  

  15. Numbers may not add due to rounding.
  16.  

Between the end of 2022 and the present, Radisson completed approximately 50,000 m of additional drilling at the Project. Drilling that was completed within the volume of the MRE is assessed to have no material impact on the overall contained mineral resource, such that the MRE is appropriate in SLR’s opinion for mine planning. Drilling that was completed outside the volume of the MRE, including below the level of the historic mine workings at O’Brien, has indicated the presence of significant additional gold mineralization that is not incorporated in the current conceptual mine plan. Radisson expects to complete a further 50,000-60,000 m of drilling in 2025 and 2026, at which time the Company expects to complete an updated MRE.


Mining


The PEA describes an 11-year mine life based on the mining of 4.57 Mt of mineralized material and 3.31 Mt of waste rock (Table 3). Mining will be fully underground with long-hole stoping and a cemented rock backfill. Stope design is benefitted by good spatial continuity of reported resource blocks at the lower cut-off grade. Minimum and average stope widths are 2.2 m and 2.7 m respectively, including 0.7 m of planned dilution. The mine will be accessed by way of twin 4.5 m by 4.5 m ramps from surface to a depth of 950 m with 86 kilometres (km) of development. Mining equipment includes 20 tonne trucks with rock haulage assisted by vertical conveyors delivering mined material from the 300 m level to a surface run-of-mine pad. The underground mine design does not incorporate any infrastructure from the historic O’Brien Mine. A shaft at the historic Kewagama Mine site east of O’Brien will be reused for ventilation. Mined material will be trucked by road for processing.


Table 3: Mined Material


Material Tonnes
(kt)
Oz
(koz Au)
Head Grade 
(g/t Au)
Production Stopes 3,146 588 5.8
Marginal Stopes 169 16 2.9
Development 469 91 6.0
Low-Grade Development 790 45 1.8
Total Mineralized Mined Material 4,575 740 5.0
Waste 3,314 n/a n/a


Cannot view this image? Visit: https://images.newsfilecorp.com/files/10977/258183_1e2a85bb743ed9d7_002.jpg


Figure 1: Annual Average Production Schedule


To view an enhanced version of this graphic, please visit:
https://images.newsfilecorp.com/files/10977/258183_1e2a85bb743ed9d7_002full.jpg


The underground mine was designed and production scheduled on the basis of a DSO optimization at US$2,000 Au and production cut-off grades of 3.05 g/t Au and 3.11 g/t Au depending on the royalty to be considered. ‘Mined Material’ is categorized as Production Stope Material, Marginal Stope Material, Development Material, Low-Grade Development Material and Waste. In Years 2-8 during which the Project maintains steady-state operation, production from stopes averages 1,160 tpd. However, the PEA contemplates up to 2,000 tpd of mill capacity. Consequently, all mineralized mined material is scheduled for processing (Figure 1), resulting in an average head grade of 5.0 g/t Au, delivering an average of 1,410 tonnes of mined material daily to the mill, and eliminating the requirement for a low-grade stockpile.


Mineral Resources not included in the mine plan are those considered too isolated or too marginal at a US$2,000/oz DSO optimization. The mine design also excludes Mineral Resources located in the former Thompson Cadillac mine area or in areas considered too close to the historic workings. The quantity of mineralized mined material in the mine design is highly sensitive to the gold price assumption, with the DSO optimization delivering significantly more mined material in both existing production stopes and development areas, as well new stopes and development areas, at higher gold prices.


Infrastructure and Site Facilities


The Project is located adjacent to the Trans-Canada Highway 117 and has existing road access to the historic O’Brien mine site. The PEA contemplates twin underground mine portals located 2 km to the east of the historic site, with new haul roads, a waste rock pad, a run-of-mine pad, laydown areas, the surface installation of a vertical conveyor, trenches and sumps for water management, and a waste-water treatment plant. The PEA does not contemplate a mill, tailings deposition, accommodation camp, or major maintenance facilities. Small vehicle maintenance and site offices/mine dry will be provided from existing facilities or temporary modules. A new substation will derive power from the adjacent 112 kV high voltage transmission line operated by Hydro-Québec.


Processing(See footnote 1)


The PEA contemplates processing and tailings deposition at an off-site facility. To assess the viability of this scenario, Radisson conducted a metallurgical study and milling assessment under the auspices of an MOU with IAMGOLD to assess the design criteria for processing O’Brien mined material at the nearby Doyon gold mill, the processing facility for IAMGOLD’s Westwood Mine Complex. The Doyon mill is located 21 km west of O’Brien and directly accessible along Trans-Canada Highway 117.


The metallurgical results of this milling assessment were previously reported (see Radisson news release dated February 3, 2025) and are incorporated into the PEA. Gold recoveries of between 86% and 96% were obtained based on a series of flow sheet options, all of which are compatible with the Doyon mill with minimal or modest additional capital. The metallurgical program was undertaken at the Lakefield, Ontario facilities of SGS Canada Inc. under the supervision of Ausenco.


The Doyon mill currently operates at approximately 3,000 tpd with a conventional cyanidation process. Mined material is processed with a primary crusher and a two-stage semi-autogenous SAG mill/Ball mill grinding at 75 µm (P80). Leaching is by way of two stage Carbon-in-Leach and Carbon-in-Pulp circuits. The PEA contemplates a Gravity-Flotation-Regrind-Leach flow sheet and assumes Radisson deploying $21M of capital to upgrade the gravity and flotation circuits at Doyon that have been used previously but are currently inactive.


The Doyon mill currently processes approximately 1,000 tpd from the underground Westwood mine and approximately 2,000 tpd from the nearby Grand Duc open pit. Processing of Grand Duc material is estimated to be completed in early 2027, as outlined in the Westwood Mine Complex technical report dated September 30, 2024. Hence, the PEA envisions up to 2,000 tpd of mill capacity available for O’Brien at Doyon, allowing for the direct shipment of both production material and lower grade development material at an average of 1,400 tpd. The PEA does not anticipate the stockpiling of low-grade mined material at the O’Brien site, resulting in a significant cost saving.


Life-of-mine average gold recovery with the Gravity-Flotation-Regrind-Leach flowsheet is estimated at 87%. This is based on 90% recovery for the O’Brien metallurgical sample at an average grade of 6.3 g/t Au and the application of a grade-recovery model to the average head-grade expected in the PEA of 5.0 g/t Au after the processing of low-grade development materials.


O’Brien gold mineralization is associated with pyrite and arsenopyrite. The metallurgical program determined average arsenic values of 0.4% to 0.5% in whole rock, relevant if material is being sent to tailings deposition on-site, and 4.6% in flotation concentrate, relevant if a concentrate is being sold to an off-take agent. These values are consistent with precedent projects in Québec’s Abitibi and offtake threshold limits for concentrates of high-grade gold projects. The PEA contemplates tailings deposition after leach without a segregated tailings impoundment. If one is required, additional capital expenses would be incurred.


The PEA contains estimates of operating and capital costs for trucking, processing, tailings management and G&A developed by Ausenco from first principles based on the metallurgical results and precedent projects. These costs correspond well to recently reported operating results from the Doyon facility. The PEA’s financial results reflect an additional 30% charge on processing and G&A costs, corresponding to approximately $19/t, to reflect the impact of a potential toll milling charge. The MOU between Radisson and IAMGOLD contains no specific terms around potential commercial arrangements between the Parties, including the use of the Doyon mill or the terms of potential toll-milling. There is no certainty that any arrangement between the Parties will result from their dealings pursuant to the MOU, which is non-binding and non-exclusive.


Capital and Operating Costs(See footnote 1)


Initial Capital costs (Table 4) are estimated at $175M and reflect costs incurred during a 21-month period of early works, mill modification and principal mine construction to the end of the first quarter of Year 2 and the attainment of commercial production. The Initial Capital cost estimate excludes both pre-production mine operating costs and revenue, which are reflected in the Life-of-mine operating cost and revenue estimates, and excludes development costs incurred prior to the commencement of early works. Contingencies on individual capital line items in the underground mine design are at 15%, developed within the material, productivity and cost estimates. Contingencies on non-underground mine items, and on mill modifications and surface facilities, are at 25%.


Life-of-mine Sustaining Capital costs are estimated at $173M and reflect capital costs incurred after the first quarter of Year 2, including underground mine development costs in waste rock and underground mine infrastructure, but excluding mine closure and salvage. Mobile mining equipment is scheduled to be purchased in installments, and is represented as Initial Capital, to the extent that a payment or deposit occurs within the project construction period, and as Sustaining Capital to the extent it occurs during the operating phase.


Table 4: LOM Capital Costs


 Itemnote 1,2 Cost (C$M)
Mining Capex $93
Mobile Equipment $25.7
Mine Development $47.4
Buildings $0.4
Mine Services $19.7
Process Plant $21
Flotation $4.5
Regrind $14.1
Reagents $2.0
Onsite Infrastructure $16
Offsite Infrastructure $8
Indirects $14
Owners Costs $4
Cash Contingency $20
Total Initial Capital $175
   
Sustaining Capital $173
Closure $5
Salvage $(3)
Total $ 350


Notes: 


  1. Denotes a ‘specified financial measure’ within the meaning of NI 52-112. See note on ‘Non-IFRS Financial Measures’. 
  2.  

  3. Columns may not sum exactly due to rounding.
  4.  

Mining, haulage and water management operating costs (Table 5) are estimated at $75.66/t milled (LOM). These are developed by Norda Stelo from first principles based on recent precedent projects with similar mining methodologies and location. Total life-of-mine mining costs, including mining related Initial Capital, Sustaining Capital and Operating costs are $581M, or $127/t milled. Processing and G&A cost estimates are developed by Ausenco from first principles based on the results of the milling assessment conducted at the Doyon mill and based on recent precedent projects. Toll Milling Charges are conceptual and have been estimated by Ausenco based on recent industry precedent.


Total Cash Costs are US$861/oz with AISC of US$1,059/oz (LOM). AISC³ during the steady-state operations of Years 2-8 is estimated at US$1,106/oz.


Table 5: Life-of-Mine Operating Costs and AISC


 Itemnote1,2 Value Units
Mining, Haulage and Water Management $346 C$M
$75.66 C$/t milled
Processing & Tailings Treatment $173 C$M
$37.71 C$/t milled
 Process Toll note3 $87 C$M
$18.94 C$/t milled
G&A $142 C$M
$31.06 C$/t milled
Total $747 C$M
$163.38 C$/t milled
Off-Site Costs, Refining and Transport $6 C$M
Royalties $10 C$M
Total Cash Costs $861 US$/oz Au
Sustaining, Closure, Salvage Capital $197 US$/oz Au
 Total AISCnote4 $1,059 US$/oz Au


Notes: 


  1. Denotes a ‘specified financial measure’ within the meaning of NI 52-112. See note on ‘Non-IFRS Financial Measures’.
  2.  

  3. Columns may not sum exactly due to rounding.
  4.  

  5. Conceptual and estimated based on recent industry precedent.
  6.  

  7. AISC includes Royalties, Total Cash Costs and Sustaining Capital, including closure costs and corporate G&A.
  8.  

Financial Analysis 


At a long-term consensus gold price of US$2,550 and an exchange rate of 0.73 (US$/C$) the Project generates an after-tax NPV5% of $532M and IRR of 48% (unlevered; Table 6). Payback on initial capital is 2.0 years. The Project’s valuation is discounted to Year -0.5 when early works would be scheduled to commence.


Table 6: Valuation Sensitivities to the Gold Price (after-tax, unlevered)


 Gold Price (US$/oz)
Price Case 
 $1,800 Downside  $2,200  $2,550
Base Case 
 $3,000
Upside 
 $3,300
Spot  
$4,000
After Tax NPV (C$M) 0% $340 $587 $803 $1,081 $1,266 $1,698
3% $244 $448 $626 $856 $1,009 $1,366
5% $193 $374 $532 $736 $871 $1,188
8% $134 $286 $419 $591 $705 $971
10% $102 $239 $358 $512 $614 $853
IRR 21% 35% 48% 64% 74% 100%
 NPV5%/Capex  1.1 2.1 3.0 4.2 5.0 6.8
 Paybacknote 2 Years 4.3 2.7 2.0 1.4 1.1 0.7
 Total After Tax FCFnote1, 3 C$M $340 $587 $803 $1,081 $1,266 $1,698
 Average Annual FCFnote1, 4 C$M $48 $74 $97 $127 $147 $194


Notes: 


  1.  Denotes a ‘specified financial measure’ within the meaning of NI 52-112. See note on ‘Non-IFRS Financial Measures’. 
  2.  

  3.  Payback is defined as achieving cumulative positive free cashflow after all cash costs and capital costs, including sustaining. 
  4.  

  5.  Calculated LOM, unlevered. 
  6.  

  7.  Calculated for Years 2-8 of steady state production, unlevered. 
  8.  

LOM EBITDA is estimated at $1.5 billion (‘B’), with an effective EBITDA margin of 66%. LOM after-tax FCF is estimated at $0.8B on an unlevered basis. Annual average after-tax FCF during the steady-state operations of Years 2-8 is estimated at $97M. The Project is forecast to generate federal and provincial income taxes and mining duties of $343M.


At spot gold of US$3,300/oz gold, the Project generates an after-tax NPV5% of $871M, IRR of 74%, and payback on initial capital of 1.1 years. The Project is cash positive after-tax at gold prices above US$1,260/oz.


The Project is most sensitive to revenue attributes such as gold price, head grade and exchange rate, followed by operating cost and capital cost (unlevered; Table 7). Valuation sensitivities on conceptual toll-milling charges expressed as margins on processing and G&A costs of between 0% and 60%. At 0% toll, the Project has an after-tax NPV5% of $578M and IRR of 52% (unlevered; Table 8).


A 2% Net Smelter Royalty (‘NSR’) is applied on gold production on certain claims on the easternmost portion of the property in the favour of Globex Mining Enterprises Inc., covering approximately 22% of the scheduled gold production.


Table 7: Valuation Sensitivities to Certain Operating Parameters (after-tax, unlevered)


Factor -20% -10% 0% 10% 20%
Operating Cost IRR 55% 51% 48% 44% 40%
NPV5% $611 $572 $532 $493 $454
Initial Capital Cost IRR 57% 52% 48% 44% 41%
NPV5% $557 $545 $532 $520 $508
0.65 0.70 0.73 0.80 0.85
$C:$US F/X IRR 59% 52% 48% 40% 35%
NPV5% $674 $582 $532 $432 $370


Table 8: Project Sensitivity to Potential Toll-Milling Charges (after-tax, unlevered)


Toll Margin 0% 30% 60%
IRR 52% 48% 44%
NPV5% $578M $532M $487M


Cautionary statement: Readers are cautioned that the PEA is preliminary in nature, it includes inferred mineral resources that are considered too speculative geologically to have economic considerations applied to them that would enable them to be categorized as mineral reserves, and there is no certainty that the PEA will be realized.


Permitting and Environmental Assessment


The Project is located within the Abitibi-Témiscamingue region of Québec in the township of Cadillac, part of the municipality of Rouyn-Noranda. First Nations (‘FN’) within the Project’s expected area of expected economic and social influence are the Pikogan FN (Abitibiwinni) and Long Point FN (Anishinabeg). BBA Inc. were retained to provide a roadmap for social and environmental assessment and mine permitting based on the project scope presented in the PEA. A 3.5-year process of environmental assessment, technical studies, community consultation and permitting is anticipated prior to the commencement of mine construction. The Project is subject to the Québec Environmental Quality Act (‘EQA’) and, following changes to the EQA proposed in the November 2024 Act to Amend the Mining Act and Other Provisions, is expected to be subject to a Québec Environmental Impact Assessment and Review. The Project is not expected to be subject to a Federal Impact Assessment procedure but will be subject to the Metal and Diamond Mining Effluent Regulations (Fisheries Act).


NI 43-101 Technical Report


Radisson will file a Technical Report prepared in accordance with the requirements of National Instrument 43-101 – Standards of Disclosure for Mineral Projects (‘NI 43-101’) for the O’Brien Gold Project Preliminary Economic Assessment on SEDAR+ on or before August 21, 2025.


Qualified Persons


Disclosure of a scientific or technical nature in this news release was prepared under the supervision of Mr. Richard Nieminen, P.Geo, (QC), a geological consultant for Radisson and a Qualified Person for purposes of NI 43-101. Mr. Nieminen is independent of Radisson and the O’Brien Gold Project.


Renée Barrette of Ausenco Engineering Canada ULC, is the Qualified Person responsible for the preparation of the Project’s milling assessment, PEA metallurgy, and for PEA financial model which is based on capital costs, operating costs, and the mining cost provided by other parties.


Mr. Luke Evans, M.Sc., P.Eng., ing, of SLR Consulting (Canada) Ltd., is the Qualified Person responsible for the preparation of the MRE at O’Brien.


Mr. Marc R. Beauvais, P.Eng. of InnovExplo, a member of Norda Stelo, is the Qualified Person responsible for the mine design and mine scheduling.


Mr. Hugo Latulippe of BBA is the Qualified Person responsible for the permitting, environmental, social, water management and closure cost estimate.


Each of Mr. Nieminen, Ms. Barrette, Mr. Evans, Mr. Beauvais and Mr. Latulippe have reviewed and approved the technical information contained in the PEA and in this press release in their area of expertise and are considered to be ‘independent’ of Radisson and the O’Brien Gold Project for purposes of NI 43-101.


Non-IFRS Financial Measures


The Company has included various references in this document that constitute ‘specified financial measures’ within the meaning of National Instrument 52-112 Non-GAAP and Other Financial Measures Disclosure of the Canadian Securities Administrators, such as, for example, Free Cash Flow, EBITDA, Total Cash Cost and All-In Sustaining Cost. None of these specified measures is a standardized financial measure under International Financial Reporting Standards (‘IFRS’) and these measures might not be comparable to similar financial measures disclosed by other issuers. Each of these measures are intended to provide additional information to the reader and should not be considered in isolation or as a substitute for measures prepared in accordance with IFRS. Certain non-IFRS financial measures used in this news release and common to the gold mining industry are defined below.


Total Cash Cost and Total Cash Cost per Ounce


Total Cash Cost is reflective of the cost of production. Total Cash Cost reported in the PEA include mining costs, processing & water treatment costs, general and administrative costs of the mine, off-site costs, refining costs, transportation costs and royalties. Total Cash Cost per Ounce is calculated as Total Cash Cost divided by payable gold ounces.


All-in Sustaining Cost (AISC) and AISC per Ounce


AISC is reflective of all of the expenditures that are required to produce an ounce of gold from operations. AISC reported in the PEA includes total cash costs, sustaining capital, expansion capital and closure costs, but excludes corporate general and administrative costs and salvage. AISC per Ounce is calculated as AISC divided by payable gold ounces.


Free Cash Flow (FCF)


FCF deducts capital expenditures from net cash provided by operating activities. Management believes this to be a useful indicator of our ability to operate without reliance on additional borrowing or usage of existing cash. Free cash flow is intended to provide additional information only and does not have any standardized definition under IFRS and should not be considered in isolation or as a substitute for measures of performance prepared in accordance with IFRS. The measure is not necessarily indicative of operating profit or cash flow from operations as determined under IFRS. Other companies may calculate this measure differently.


Earnings Before Interest, Taxes, Depreciation and Amortization (EBITDA)


EBITDA excludes from net earnings income tax expense, finance costs, finance income and depreciation. Management believes that EBITDA is a valuable indicator of our ability to generate liquidity by producing operating cash flow to fund working capital needs, service debt obligations, and fund capital expenditures. Management uses EBITDA for this purpose.


About Radisson Mining


Radisson is a gold exploration company focused on its 100% owned O’Brien Gold Project, located in the Bousquet-Cadillac mining camp along the world-renowned Larder-Lake-Cadillac Break in Abitibi, Québec. A July 2025 Preliminary Economic Assessment described a low cost and high value project with an 11-year mine life and significant upside potential based on the use of existing regional infrastructure. Indicated Mineral Resources are estimated at 0.58 million ounces (2.20 million tonnes at 8.2 g/t Au), with additional Inferred Mineral Resources estimated at 0.93 million ounces (6.67 million tonnes at 4.4 g/t Au). Please see the NI 43-101 ‘Technical Report on the O’Brien Project, Northwestern Québec, Canada’ effective March 2, 2023 and other filings made with Canadian securities regulatory authorities available at www.sedarplus.ca for further details and assumptions relating to the O’Brien Gold Project.


For more information on Radisson, visit our website at www.radissonmining.com or contact:


Matt Manson
President and CEO
416.618.5885
mmanson@radissonmining.com


Kristina Pillon
Manager, Investor Relations
604.908.1695
kpillon@radissonmining.com


Forward-Looking Statements


This news release contains ‘forward-looking information’ within the meaning of the applicable Canadian securities legislation that is based on expectations, estimates, projections, and interpretations as at the date of this news release. Forward-looking statements including, but are not limited to, statements with respect to the ability to execute the Company’s plans relating to the O’Brien Gold Project as set out in the PEA; the Company’s ability to complete its planned exploration and development programs; the absence of adverse conditions at the O’Brien Gold Project; the absence of unforeseen operational delays; the absence of material delays in obtaining necessary permits; the price of gold remaining at levels that render the O’Brien Gold Project profitable; the Company’s ability to continue raising necessary capital to finance its operations; the ability to realize on the mineral resource and mineral reserve estimates; assumptions regarding present and future business strategies, local and global geopolitical and economic conditions and the environment in which the Company operates and will operate in the future;, planned and ongoing drilling, the significance of drill results, the ability to continue drilling, the impact of drilling on the definition of any resource, and the ability to incorporate new drilling in an updated technical report and resource modelling; the Company’s ability to grow the O’Brien Gold Project; the ability to negotiate and execute an arrangement with IAMGOLD related to the Doyon Mill on satisfactory terms or at all; and the ability to convert inferred mineral resources to indicated mineral resources.


Any statement that involves discussions with respect to predictions, expectations, interpretations, beliefs, plans, projections, objectives, assumptions, future events or performance (often but not always using phrases such as ‘expects’, or ‘does not expect’, ‘is expected’, ‘interpreted’, ‘management’s view’, ‘anticipates’ or ‘does not anticipate’, ‘plans’, ‘budget’, ‘scheduled’, ‘forecasts’, ‘estimates’, ‘believes’ or ‘intends’ or variations of such words and phrases or stating that certain actions, events or results ‘may’ or ‘could’, ‘would’, ‘might’ or ‘will’ be taken to occur or be achieved) are not statements of historical fact and may be forward-looking information and are intended to identify forward-looking information. Except for statements of historical fact relating to the Company, certain information contained herein constitutes forward-looking statements. Forward-looking information is based on estimates of management of the Company, at the time it was made, involves known and unknown risks, uncertainties and other factors which may cause the actual results, performance or achievements of the companies to be materially different from any future results, performance or achievements expressed or implied by such forward-looking information. Such factors include, among others; the risk that the O’Brien Gold Project will never reach the production stage (including due to a lack of financing); the Company’s capital requirements and access to funding; changes in legislation, regulations and accounting standards to which the Company is subject, including environmental, health and safety standards, and the impact of such legislation, regulations and standards on the Company’s activities; price volatility and availability of commodities; instability in the global financial system; the effects of high inflation, such as higher commodity prices; the risk of any future litigation against the Company; changes in project parameters and/or economic assessments as plans continue to be refined; the risk that actual costs may exceed estimated costs; geological, mining and exploration technical problems; failure of plant, equipment or processes to operate as anticipated; accidents, labour disputes and other risks of the mining industry; delays in obtaining governmental approvals or financing; risks relating to the drill results at O’Brien; the significance of drill results; and the ability of drill results to accurately predict mineralization. Although the forward-looking information contained in this news release is based upon what management believes, or believed at the time, to be reasonable assumptions, the parties cannot assure shareholders and prospective purchasers of securities that actual results will be consistent with such forward-looking information, as there may be other factors that cause results not to be as anticipated, estimated or intended, and neither the Company nor any other person assumes responsibility for the accuracy and completeness of any such forward-looking information. The Company believes that this forward-looking information is based on reasonable assumptions, but no assurance can be given that these expectations will prove to be correct and such forward-looking statements included in this press release should not be unduly relied upon. The Company does not undertake, and assumes no obligation, to update or revise any such forward-looking statements or forward-looking information contained herein to reflect new events or circumstances, except as may be required by law. These statements speak only as of the date of this news release.


Please refer to the ‘Risks and Uncertainties Related to Exploration’ and the ‘Risks Related to Financing and Development’ sections of the Company’s Management’s Discussion and Analysis dated April 29, 2025 for the years ended December 31, 2024, and the Company’s Management’s Discussion and Analysis dated May 28, 2025 for the three-months ended March 31, 2025, all of which are available electronically on SEDAR+ at www.sedarplus.ca. All forward-looking statements contained in this press release are expressly qualified by this cautionary statement.


Neither the TSX Venture Exchange nor its Regulation Services Provider (as that term is defined in the policies of the TSX Venture Exchange) accepts responsibility for the adequacy or accuracy of this news release. No stock exchange, securities commission or other regulatory authority has approved or disapproved the information contained herein.


1 IAMGOLD has not independently confirmed the processing assumptions, metallurgical results and/or cost assumptions associated with the required mill upgrades in the scenarios outlined in the PEA.
2 Denotes a ‘specified financial measure’ within the meaning of National Instrument 52-112 Non-GAAP and Other Financial Measures Disclosure of the Canadian Securities Administrators (‘NI 52-112’). See note on ‘Non-IFRS Financial Measures’.


Corporate Logo


To view the source version of this press release, please visit https://www.newsfilecorp.com/release/258183


News Provided by Newsfile via QuoteMedia

This post appeared first on investingnews.com

President Donald Trump confirmed Tuesday (July 8) he would impose a 50 percent tariff on all copper imports, a dramatic escalation of his administration’s use of targeted trade restrictions under national security grounds.

“I believe the tariff on copper, we’re going to make 50 percent,” Trump said during a White House cabinet meeting.

Though he did not provide a timeline, Commerce Secretary Howard Lutnick said in a subsequent CNBC interview that the tariff could take effect by late July or as early as August 1, with details to be posted on Trump’s Truth Social account.

The announcement triggered immediate market reaction. According to Reuters, copper futures for September delivery surged 13 percent on the day, closing at US$5.6855 per pound—its biggest single-day jump since 1989.

Traders cited fears of a supply crunch and price volatility as buyers scrambled to secure US-bound shipments ahead of the tariff implementation.

The decision marks a culmination of a months-long process that began in February, when Trump signed an executive order instructing the Department of Commerce to investigate whether copper imports posed a national security threat under Section 232 of the Trade Expansion Act of 1962.

The rarely used statute gives the president broad authority to impose tariffs or quotas if imports are deemed harmful to national defense or essential industries.

The copper tariff follows a similar pattern established during Trump’s first term, when the White House used Section 232 to levy tariffs on steel and aluminum.

Since returning to office, Trump has expanded his use of the provision to include automobiles, pharmaceuticals, and critical minerals like rare earths.

Countries in the crosshairs

The brunt of the copper tariff is expected to fall on key US trade partners—most notably Chile, Canada, and Mexico, which collectively accounted for the majority of America’s US$17 billion in copper imports in 2024, according to US Census Bureau data.

Chile alone shipped US$6 billion worth of copper to the US last year.

Officials from Chile, Canada, and Peru, have pushed back against the measure, arguing their exports pose no threat to US national security and citing long-standing free trade agreements.

However, none have been granted exemptions as of Wednesday (July 9), and negotiations remain in limbo.

The looming copper tariff comes on the heels of broader trade actions taken by the Trump administration. On Monday (July 7), the White House imposed stiff tariffs on imports from 14 countries, including Japan, South Korea, Malaysia, South Africa, and Kazakhstan.

These levies—effective August 1—targeted a wide range of sectors, from steel and aluminum to automotive parts and textiles.

Despite its relatively small trade deficit in copper—the US exported US$11.3 billion and imported US$9.6 billion worth of the metal in 2024—the White House argues that the country remains dangerously reliant on foreign refining and processing capacity.

National security as justification

The legal foundation for the copper tariff lies in Section 232, which allows the president to act unilaterally on trade when national security is at stake. Experts say the provision gives Trump more durable legal ground than his recent attempts to use emergency powers to implement broad, country-specific tariffs—some of which are being challenged in federal court.

“Section 232 tariffs are central to President Trump’s tariff strategy,” said Mike Lowell, a trade attorney with ReedSmith, in an interview with CNBC. “They aren’t the target of the pending litigation, and they’re more likely to survive a legal challenge and continue into the next presidential administration.”

The administration’s increasing reliance on Section 232 tariffs reflects a shift toward industrial policy motivated by supply chain security, particularly for materials with dual-use applications in civilian and defense sectors.

Copper is a case in point. Used extensively in electrical wiring, motors, semiconductors, and military-grade communications equipment, the red metal has been classified as critical to US infrastructure and defense capabilities.

Analysts point out that demand for the red metal is set to surge in the coming years due to the ongoing energy transition and growing adoption of electric vehicles.

In April, Trump issued a separate executive order launching a Section 232 investigation into US reliance on imported critical minerals and processed rare earths, calling them “essential for national security and economic resilience.” The order cited specific applications in jet engines, missile guidance, radar systems, and advanced electronics.

As of Wednesday, no formal timeline had been posted on Trump’s Truth Social account, and details around carve-outs or exemptions remained unclear.

For now, however, Trump appears undeterred. The head of state has already threatened that pharmaceuticals may be next in line for potential action.

Securities Disclosure: I, Giann Liguid, hold no direct investment interest in any company mentioned in this article.

This post appeared first on investingnews.com