–
Domestic Metals Corp. (the ‘Company‘ or ‘Domestic Metals‘) – (TSXV: DMCU,OTC:DMCUF; OTCQB: DMCUF; FSE: 03E0) has expanded its exploration targeting budget based on high-grade copper, gold and silver results from the Company’s recently completed surface exploration program (see news release dated January 8, 2026) at the Smart Creek Copper Project. Surface rock sampling and surface geological mapping has increased the size of each of these target areas and confirms the potential for high-grade copper, gold and silver mineralization in the porphyry and epithermal environments as well as confirms the presence of related Carbonate Replacement Deposit style mineralization. The Company has now confirmed the presence of each of these styles of mineralization exposed at surface at Smart Creek and is now planning follow up diamond drilling scheduled for April 2026.
Summary of High-Grade Assay Results from 2026 Exploration
- 102 g/t Au (Sample G019007)
- 74.7 g/t Au, 13.8% Cu, 3810 g/t Ag (Sample G019235)
- 30.4 g/t Au (Sample G019001)
- 26.6 g/t Au (Sample G019353)
- 23.1% Cu, 424 g/t Ag (Sample G019225)
- 19.65% Cu, 458 g/t Ag (Sample G019031)
- 19.05% Cu, 582 g/t Ag (Sample G019038)
For additional details regarding the surface sampling results at Smart Creek please see news release dated January 8, 2026.
Smart Creek Copper Porphyry Target
Previous exploration drilling is concentrated at the Smart Creek target where surface alteration and mineralization is consistent with the distal porphyry environment. Domestic Metals has leveraged historical drilling data and newly collected surface geological and geochemical data to establish a robust exploration drilling target west of the historical drilling footprint (Figure 1). In addition, exotic copper mineralization south of the Smart Creek target (Smart Creek Exotic Copper) appears to be superimposed on distal copper porphyry related mineralization suggesting there is the potential for a second porphyry center westward of the historical drilling footprint (Figure 1).
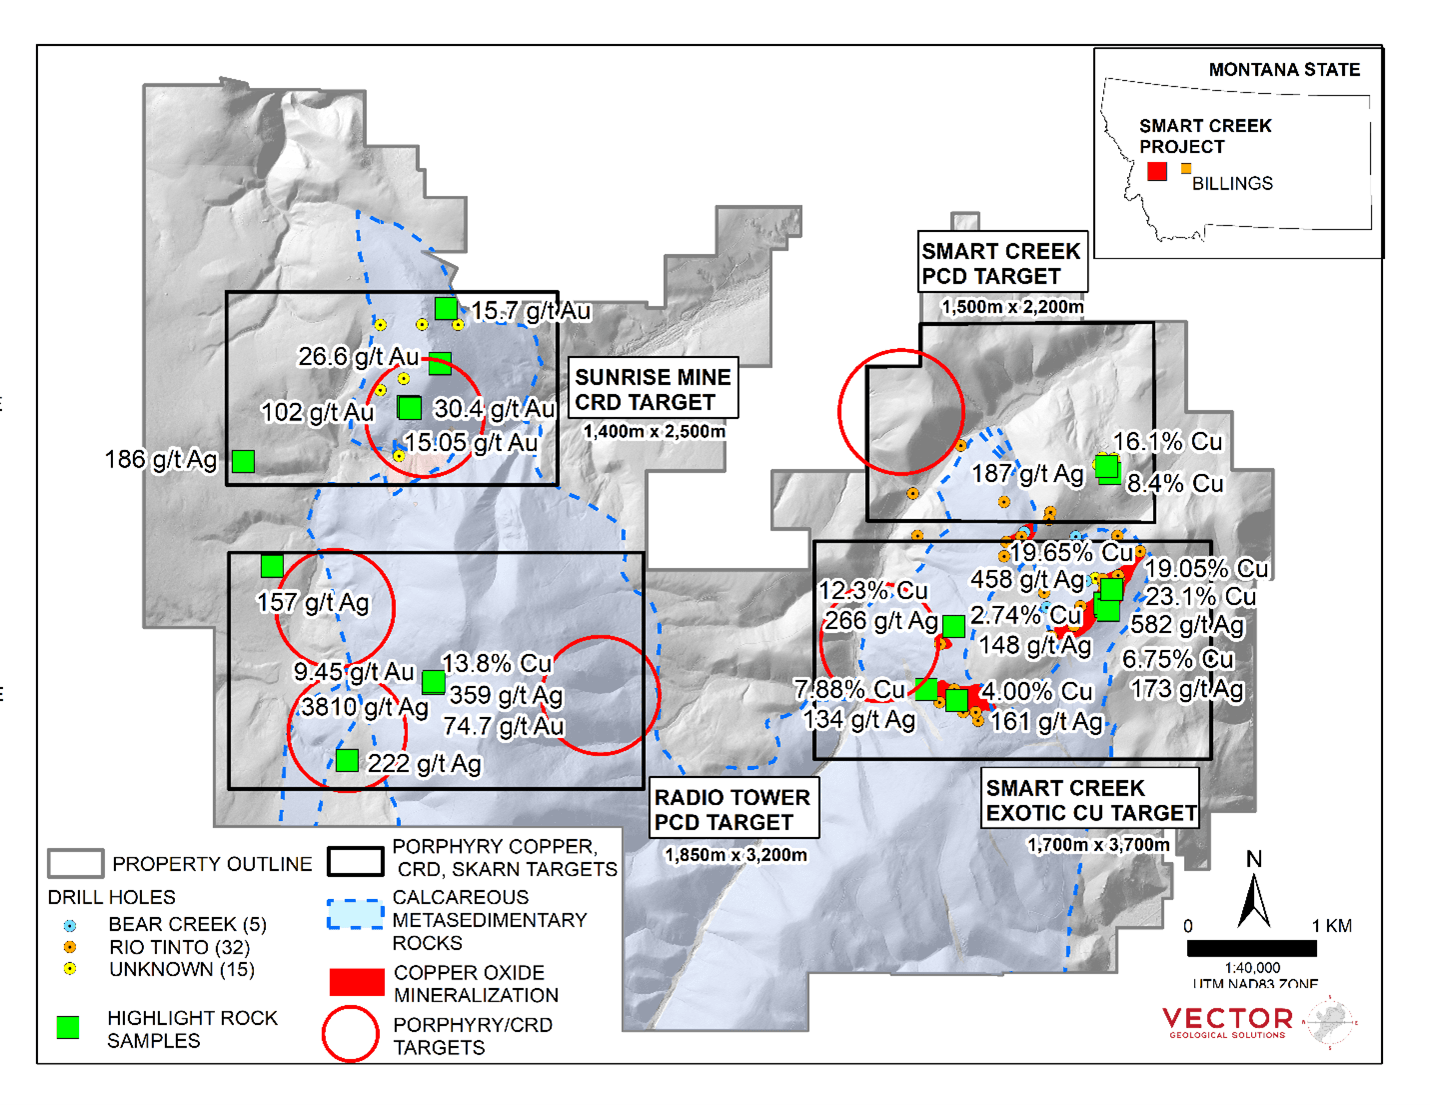
Figure 1. Favourable geology, surface mineralization, historical drilling and drill targets at Smart Creek, Montana.
Sunrise Porphyry Copper Target
Domestic Metals has identified mineralized porphyry dykes approximately 1 kilometer east of the past producing Sunrise Mine (see NR dated September 11, 2025; Figure 1). These mineralized porphyry intrusions are exposed at surface and are interpreted to represent the top of a new porphyry system at Smart Creek. The depth extent of this surface mineralization will be tested as part of the upcoming diamond drill program at Smart Creek
Radio Tower Carbonate Replacement Targets
The 2025 Surface exploration program has identified several previously unrecognized semi massive and massive sulphide CRD lenses exposed at surface internal to the Radio Tower alteration footprint (Figure 1). These high-grade copper-gold-silver lenses have been prioritize for drill delineation and will be tested after a second round of permitting is complete for the project. Additional mapping and sampling will be conducted in the Spring to further derisk these targets.
Marketing Agreement
The Company has entered into an agreement with Machai Capital Inc. dated February 27, 2026 (the ‘Machai Agreement’), pursuant to which Machai will provide public awareness activities and deploy a comprehensive digital media marketing program including multi-platform digital campaigns, social media amplification, and targeted investor communications.
The services will be conducted in accordance with the applicable policies of the TSX Venture Exchange (‘TSXV’) and the engagement of Machai is subject to the approval of the TSXV.
Machai has been engaged by the Company for a 2 month period commencing immediately. In consideration for the services provided, the Company has paid Machai CAD 300,000 plus GST. Machai is arm’s-length to the Company, has no other relationship with the Company and neither Machai nor its principal, Suneal Sandhu, has any interest, directly or indirectly, in the Company or its securities, or any right or intent to acquire such an interest, other than as disclosed herein. Machai can be contacted at suneal@machaicapital.com.
Engagement of Michael Pound
Pursuant to the Company’s news releases dated December 11, 2025 and January 23, 2026, and at the request of the TSXV, the Company provides additional further clarification, Mr. Pound was engaged on February 17, 2025 and his fees at that time were C$5,000 per month, in May of 2025, his fees increased to C$7,500 per month.
Technical Information
All scientific and technical information in this news release has been reviewed and approved by Daniel MacNeil, P.Geo. Mr. MacNeil is a Technical Advisor to the Company and is a qualified person for the purposes of National Instrument 43-101 – Standards of Disclosure for Mineral Projects.
About Domestic Metals Corp.
Domestic Metals Corp. is a mineral exploration company focused on the discovery of large-scale, copper and gold deposits in exceptional, historical mining project areas in the Americas.
The Company aims to discover new economic mineral deposits in historical mining districts that have seen exploration in geologically attractive mining jurisdictions, where economically favorable grades have been indicated by historic drilling and outcrop sampling.
The Smart Creek Project is strategically located in the mining-friendly state of Montana, containing widespread copper mineralization at surface and hosts 4 attractive porphyry copper, epithermal gold, replacement and exotic copper exploration targets with excellent host rocks for mineral deposition.
Domestic Metals Corp. is led by an experienced management team and an accomplished technical team, with successful track records in mine discovery, mining development and financing.
On behalf of Domestic Metals Corp.
Gord Neal, CEO and Director
(604) 657 7813
Follow us on:
X, LinkedIn, Facebook and Instagram
For more information on Domestic Metals, please contact:
Gord Neal, Phone: (604) 657 7813 or Michael Pound, Phone: (604) 363 2885
Please visit the Company website at www.domesticmetals.com or contact us at info@domesticmetals.com.
For all investor relations inquiries, please contact:
John Liviakis, Liviakis Financial Communications Inc., Phone: +1 415 389 4670.
Neither TSX Venture Exchange nor its Regulation Services Provider (as that term is defined in the policies of the TSX Venture Exchange) accepts responsibility for the adequacy or accuracy of this release.
Cautionary Note Regarding Forward-Looking Statements
This news release contains certain statements that may be deemed ‘forward-looking statements’. Forward-looking statements are statements that are not historical facts and are generally, but not always, identified by the words ‘expects’, ‘plans’, ‘anticipates’, ‘believes’, ‘intends’, ‘estimates’, ‘projects’, ‘potential’ and similar expressions, or that events or conditions ‘will’, ‘would’, ‘may’, ‘could’ or ‘should’ occur. Forward-looking statements may include, without limitation, statements relating to the planned exploration activities on properties. Although the Company believes the expectations expressed in such forward-looking statements are based on reasonable assumptions, such statements are not guarantees of future performance, are subject to risks and uncertainties, and actual results or realities may differ materially from those in the forward-looking statements. Such material risks and uncertainties include, but are not limited to: competition within the industry; actual results of current exploration activities; environmental risks; changes in project parameters as plans continue to be refined; future price of commodities; failure of equipment or processes to operate as anticipated; accidents, and other risks of the mining industry; delays in obtaining approvals or financing; risks related to indebtedness and the service of such indebtedness; as well as those factors, risks and uncertainties identified and reported in the Company’s public filings under the Company’s SEDAR+ profile at www.sedarplus.ca. Although the Company has attempted to identify important factors that could cause actual actions, events or results to differ materially from those described in forward-looking information, there may be other factors that cause actions, events or results not to be as anticipated, estimated or intended. Accordingly, readers should not place undue reliance on forward-looking statements. There can be no assurance that such information will prove to be accurate as actual results and future events could differ materially from those anticipated in such statements. Forward-looking statements are made as of the date hereof and, accordingly, are subject to change after such date. The Company disclaims any intention or obligation to update or revise any forward-looking information, whether as a result of new information, future events or otherwise unless required by law.
A photo accompanying this announcement is available at https://www.globenewswire.com/NewsRoom/AttachmentNg/2a3fbbc8-0774-414b-a587-29526425e414


 A large-scale porphyry copper-gold prospect ready for its first-ever drilling, in 2026