
(TheNewswire)
 |
|||||||||
 |
 |
 |
 |
 |
|||||
Provides Drilling Update at Silver King
Vancouver, British Columbia, March 5th, 2025 TheNewswire – Prismo Metals Inc. (‘Prismo’ or the ‘Company’) (CSE: PRIZ,OTC:PMOMF) (OTCQB: PMOMF) is pleased to announce the closing of its previously announced transaction with Blade Resources Inc. (‘Blade’) pursuant to which Prismo has assigned all of its rights, interests and obligations in the Hot Breccia copper project, located in the heart of the Arizona copper belt (the ‘Transaction’), to Blade.
Alain Lambert, CEO of Prismo, commented: ‘In our opinion, Hot Breccia is one of the most compelling copper exploration opportunities in North America. We remain committed to advancing it toward drilling. The principals and financial backers of Blade have a long history and strong track record in raising significant capital for exploration programs of the scale required at Hot Breccia. We expect this will result in Hot Breccia being drilled this year.’
For additional commentary on the Transaction, please watch the interview Alain Lambert gave to Radius Research:
Drilling Update at Silver King
Dr. Craig Gibson, Chief Exploration Officer of Prismo provided an update on the current drill program at the Company’s Silver King project located in Arizona: ‘The first drill hole at Silver King, SK-26-01 was drilled vertically and was successful in traversing the mineralized body as projected from the historic workings and reached a total depth of 477 feet (145 meters). Two small voids that are likely underground workings were intersected near the elevation of the 114′ level and quartz veining extended from this level for about 100 feet down hole. Visible sulfide minerals are present in several intervals and the presence of silver minerals, including native silver, was confirmed through visual identification and with a handheld XRF analyzer. Freibergite (Ag bearing tetrahedrite), stromeyerite (AgCuS) and probably acanthite (AgS) are also present. The second hole, SK-26-02 is currently at a depth of 155 feet.’
Phase 1 Drill Program Highlights:
-
1,000 meters of diamond drilling to test the upper portion of the steeply plunging, pipe-like Silver King mineralized body
-
Fully funded program
-
Additional drilling to test lower down in the mineralized structure and mineralized areas adjacent to the historic mine may also be completed
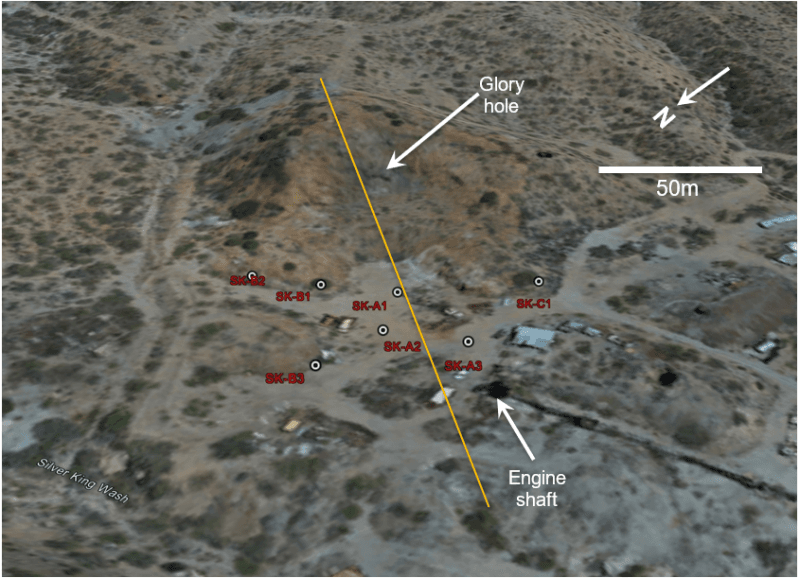
Click Image To View Full Size
Fig. 1. Permitted drill sites planned for initial Phase I drilling at the Silver King mine shown by white dots. The orange line indicates the approximate location of the cross section in Fig. 2. View looking south-easterly.
Drilling is currently focused on testing the upper portion of the steeply west-dipping pipelike stockwork and breccia zone that historically produced high-grade silver and base metals (Fig. 2), as well as targets adjacent to and beneath historic workings. Initial drilling is estimated at 1,000 meters in nine holes. A second phase of drilling will be dedicated to testing at deeper levels and areas adjacent to the historic mine. The silver mineralization at Silver King is similar to that of portions of the nearby Magma Mine, and exploration for nearby copper mineralization is warranted.
The Magma Mine and Silver King Mine share a common regional geological framework in the Superior Mining District, characterized by a Precambrian to Paleozoic stratigraphic sequence including Pinal Schist basement, diabase sills, the Apache Group sediments, and Paleozoic limestones like the Martin Formation, all tilted eastward and intruded by Laramide-age igneous bodies such as quartz diorite stocks and andesite sills. While both exhibit fault-controlled mineralization—east-trending faults and veins with hydrothermal alteration like silicification and potassic zoning—Silver King features epithermal-mesothermal silver-dominant veins in porphyry with minerals like stromeyerite, tetrahedrite, and acanthite, contrasting Magma’s mesothermal copper-focused veins and limestone replacement ores (mantos) rich in chalcopyrite and bornite. This vertical zoning suggests Silver King’s shallower silver-enriched system may transition into deeper copper styles like Magma’s, with overlapping sulfides indicating potential for untapped polymetallic extensions, especially given Magma’s link to the underlying Resolution Copper porphyry deposit.
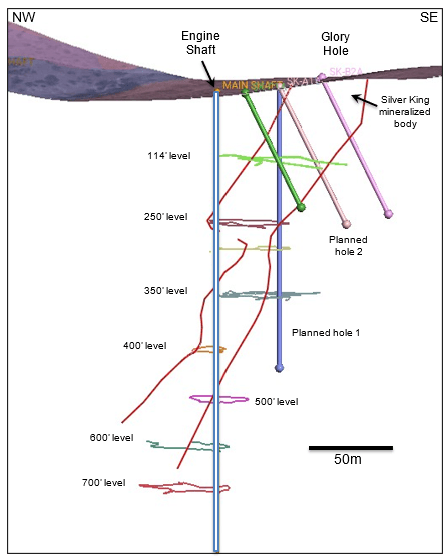
Fig. 2. Cross section through Silver King mine showing workings and first four planned drill holes.
Click Image To View Full Size
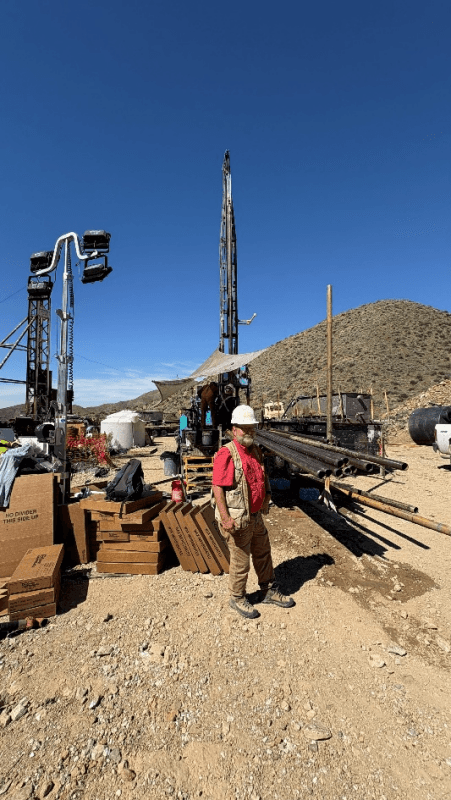
Chief Exploration Officer Dr. Craig Gibson supervising drilling at Silver King
Click Image To View Full Size
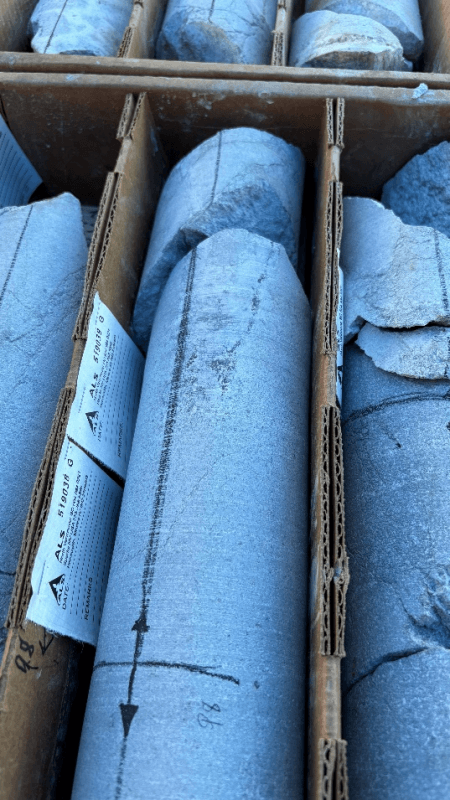
Core logging at Silver King, hole SK-26-01
Additional Information on the Transaction
In consideration for the Transaction, Prismo was issued 6,755,000 common shares of Blade and received a cash payment of $185,000. Following completion of the Transaction, Prismo owns approximately 24% of Blade’s issued and outstanding shares and is Blade’s largest single shareholder (see additional early warning disclosure below).
Strategic Rationale of the Transaction
The Transaction provides several strategic benefits:
-
Value Creation: Prismo is leveraging its investments in Hot Breccia into a significant stake in a company dedicated to advancing the Hot Breccia project.
-
Access to Capital with Limited Dilution: The structure provides enhanced access to capital for the Hot Breccia drill program through Blade, without direct dilution to Prismo shareholders.
-
Strategic Focus: Prismo will focus on advancing its remaining Arizona projects — Silver King and Ripsey Gold — while Blade dedicates its efforts to advancing Hot Breccia.
-
Enhanced Attractiveness to Strategic Partners: With the potential for 100% ownership of Hot Breccia, Blade will be in a better position to possibly attract majors or strategic buyers.
Additional Prismo Rights under the Transaction
Under the terms of the Transaction:
-
Prismo has the right to nominate one representative to Blade’s board of directors. The Company has not yet determined its initial nominee.
-
Blade has granted Prismo participation rights in future equity offerings, allowing Prismo to subscribe for shares on substantially the same terms as other investors in order to maintain its undiluted ownership percentage in Blade.
Early Warning Disclosure
This news release is issued in accordance with National Instrument 62-103 – The Early Warning System and Related Take-Over Bid and Insider Reporting Issues. Prior to the Transaction, Prismo did not own any common shares of Blade. The common shares of Blade were acquired by Prismo for a total consideration of $2,364,250 and were acquired for investment purposes with a view to Blade’s potential listing on a Canadian stock exchange.
Except as described in this news release, Prismo has no present plans or intentions that relate to or would result in any of the matters enumerated in paragraphs (a) through (k) of Item 5 of Form 62-103F1.
Prismo will file an early warning report in accordance with applicable securities laws, which will be available under Blade’s profile on SEDAR+ at www.sedarplus.ca . A copy of the early warning report may be obtained by contacting Gordon Aldcorn at the contact details below.
Qualified Person
Dr. Craig Gibson, PhD., CPG., a Qualified Person as defined by NI-43-01 regulations and Chief Exploration Officer and a director of the Company, has reviewed and approved the technical disclosures in this news release.
About Prismo Metals Inc.
Prismo (CSE: PRIZ,OTC:PMOMF, OTCQB: PMOMF) is a mining exploration company focused on advancing its Silver King, Ripsey and Hot Breccia projects in Arizona and its Palos Verdes silver project in Mexico.
About Blade Resources Inc.
Blade Resources is a private mining exploration company focused on development of North American copper and precious metals projects.
Please follow @PrismoMetals on , , , Instagram, and
Prismo Metals Inc.
1100 – 1111 Melville St., Vancouver, British Columbia V6E 3V6 Phone: (416) 361-0737
Contact:
Alain Lambert, Chief Executive Officer alain.lambert@prismometals.com
Gordon Aldcorn, President gordon.aldcorn@prismometals.com
Cautionary Note Regarding Forward-Looking Information
This release includes certain statements and information that may constitute forward-looking information within the meaning of applicable Canadian securities laws. Forward-looking information relates to future events or future performance and reflect the expectations or beliefs of management of the Company regarding future events. Generally, forward-looking statements and information can be identified by the use of forward-looking terminology such as ‘intends’ or ‘anticipates‘, or variations of such words and phrases or statements that certain actions, events or results ‘may’, ‘could’, ‘should’, ‘would’ or ‘occur’. This information and these statements, referred to herein as ‘forward‐looking statements’, are not historical facts, are made as of the date of this news release and include without limitation, statements regarding discussions of future plans, estimates and forecasts and statements as to management’s expectations and intentions with respect to, among other things: the anticipated closing and closing date of the Transaction; the strategic rationale and potential upside of the transaction with Blade, the future development of the Hot Breccia project and Blade’s ability of Blade to successfully implement its strategic and business objectives, including potentially attracting majors or strategic buyers; and the ability of Prismo to fund its exploration activities on its other projects.
These forward‐looking statements involve numerous risks and uncertainties, and actual results might differ materially from results suggested in any forward-looking statements. These risks and uncertainties include, among other things: that the Transaction may not close as anticipated, or at all; delays incurred by Blade in obtaining or failure to obtain appropriate funding to finance the exploration program at Hot Breccia; the inability of Blade to successfully acquire a 100% interest on the Hot Breccia project; delays incurred by the Company in obtaining or failure to obtain appropriate funding to finance exploration programs for its other projects; the risk that mineralization will not be as anticipated at the Hot Breccia project or at the Company’s other projects; metal prices; market uncertainty; and other risks and uncertainties application to exploration activities and the Company’s business as set forth in the Company’s disclosure documents available for viewing under the Company’s profile on SEDAR+ at www.sedarplus.com.
In making the forward-looking statements in this news release, the Company has applied several material assumptions, including without limitation, that: the ability to raise capital to fund exploration programs at Hot Breccia or on the Company’s other projects, and the timing of such exploration programs; the ability of Blade to complete the option to acquire a 100% interest in the Hot Breccia project and to successfully carry out its business and strategic objectives following completion of the transaction; and that the Hot Breccia project and the Company’s other projects will have the anticipated mineralization and other qualities.
Although management of the Company has attempted to identify important factors that could cause actual results to differ materially from those contained in forward-looking statements or forward-looking information, there may be other factors that cause results not to be as anticipated, estimated or intended. There can be no assurance that such statements will prove to be accurate, as actual results and future events could differ materially from those anticipated in such statements. Accordingly, readers should not place undue reliance on forward-looking statements and forward-looking information. Readers are cautioned that reliance on such information may not be appropriate for other purposes. The Company does not undertake to update any forward-looking statement, forward-looking information or financial out-look that are incorporated by reference herein, except in accordance with applicable securities laws. We seek safe harbor.
Copyright (c) 2026 TheNewswire – All rights reserved.
News Provided by TheNewsWire via QuoteMedia