Category

Stock

Category

Is a new market uptrend on the horizon? In this video, Mary Ellen breaks down the latest stock market outlook, revealing key signals that could confirm a trend reversal. She dives into sector rotation, explains why defensive stocks are losing ground, and shares actionable short-term trading strategies for oversold stocks. Don’t miss these crucial market insights to spot the next rally before it takes off!

This video originally premiered March 28, 2025. You can watch it on our dedicated page for Mary Ellen’s videos.

New videos from Mary Ellen premiere weekly on Fridays. You can view all previously recorded episodes at this link.

If you’re looking for stocks to invest in, be sure to check out the MEM Edge Report! This report gives you detailed information on the top sectors, industries and stocks so you can make informed investment decisions.

The key resistance level I’ve been watching on the S&P 500 hasn’t wavered. It’s 5782. The bulls had a real chance this past week to clear this important hurdle and they failed. Badly. If this was a heavyweight fight, the ref would have called it after the first round. It simply wasn’t close. Resistance failed, rotation turned bearish, volatility again expanded, and the bears are celebrating another short-term victory.

Check out this S&P 500 chart:

I’ve written about this to EarningsBeats.com members. I posted this exact chart in my StockCharts.com article a few days ago. I’ve discussed it on my YouTube shows. 5782 is THE key short-term price resistance and you can see above that the S&P 500 literally did an “about face” as soon as it touched this resistance. Sellers were lined up. Now that we’ve failed at 5782, it only makes this resistance level that much more important on any future rallies.

The serious technical damage occurred over the past 3 days as consumer discretionary stocks have been absolutely TROUNCED, while consumer staples hangs near its recent highs. If you recall, it was this HUGE disparity in consumer stocks on February 21st that triggered the massive selling episode. Now here we are again with consumer staples stocks (XLP) outperforming discretionary (XLY) by a mile. Check out this chart:

Doesn’t the action in consumer stocks the past 3 days exactly mirror the action we saw in the 2nd half of February and into the first week of March? Folks, this isn’t good.

This is just the tip of the iceberg.

Bear Market Ahead?

The S&P 500, from its recent all-time high to its subsequent low, fell 10.4%, which marks correction territory. The rally we saw off the March 13th low was likely due to oversold conditions, along with March options expiration. On Tuesday, March 18th, we discussed with our EB.com members that odds favored a short-term rally, based on max pain and we laid out key resistance from 5670 to 5782, with the 20-day EMA falling in the middle of this price range. Once we failed at 5782, it was very important to gauge the nature of any new selloff. That’s what I’ve been evaluating this week and it’s not pretty. As you can see in the chart above, money has once again started rotating into the XLP and out of the XLY. This is one of the most important intermarket relationships and it’s screaming BEARISH ACTION AHEAD!

It’s only one signal, however. I announced a few days ago that we’d be hosting a FREE webinar on Saturday morning, March 29th, at 10:00am ET. I plan to discuss several signals that are pointing to exactly what we saw on Friday – more selling. To get a better handle on current market conditions and where we’re heading, I’d encourage you to join me Saturday morning by REGISTERING HERE. If you can’t make the live webinar, we’ll still send out the recorded video to all who register, so ACT NOW!

And here’s a little secret. Shhhhhhh! Market makers are playing some serious games manipulating some of the biggest stocks. I’ll talk a bit about how we can take advantage of that Saturday morning. Hope to see you there!

Happy trading!

Tom

Sector rotation is shaping the S&P 500’s next big move! In this exclusive StockCharts video, Julius analyzes SPY support levels, key sector trends, and the latest seasonal patterns—which indicate further downside for Technology stocks. He breaks down two critical support areas that could signal the next bullish breakout or market downturn. With seasonality suggesting more weakness in tech, understanding these shifts is crucial for investors. Watch now for key stock market insights to stay ahead!

This video was originally published on March 28, 2025. Click on the icon above to view on our dedicated page for Julius.

Past videos from Julius can be found here.

#StayAlert, -Julius

This week, we get back to earnings and, sadly, the pickings are slim.

Given these turbulent times, we have two Consumer Staples stocks to examine — Lamb Weston (LW) and Conagra (CAG). They may not be the most exciting charts, but they show clear levels of interest that are worth noting.

There’s also the highly volatile stock Restoration Hardware (RH), which is trading close to a support level. This stock can be considered a high-risk, high-reward trade.

Let’s dive in…

Lamb Weston (LW)

Lamb Weston, best known for its iconic french fries, has gone on one of the wildest rides over the last four years. After a two-year uptrend, the stock has slowly and steadily gone on a two-year downtrend, giving back all its gains.

Earnings have been quite harsh over the last four quarters. There was one gain of 2.6%, with three losses that included a -19.4%, a -28.2%, and most recently a -20.1% decline. Shares now sit 54% off of all-time highs as the company heads into Thursday’s earnings report.

Technically, there is some hope.

Shares made a full roundabout from trough to peak and back to trough again, where they were able to find some major support. The $47.50/$48 level was the original double bottom that started the rally years ago, and now, when re-tested, it held again.

The risk/reward set-up appears to favor the bulls, barring another epic post-earnings drawdown. If shares sell off, the $47.50 level should get tested and could be a good entry point. However, the path to least resistance looks higher from this level. A mean reversion back to its long-term downtrend around the declining 200-day simple moving average would be good for a 23% gain.

Overall shares continue to act rather soggy, but one little quarter could spice things up and lead to a quick and satisfying return.

Restoration Hardware (RH)

Restoration Hardware has become one of the most volatile stocks after earnings over the last year-and-a-half and is one to watch with the report on Wednesday afternoon. Shares have moved an average of +/- 17% over the last six reports with gains of 17% and 25.5% over the last two.

Since last December’s 17% jump after results, the stock has declined as much as 50% from its recent highs. One major factor is the slowdown in the housing market, influenced by rising interest rates, which has dampened demand for home furnishings.

Technically, shares reached a major support level going back four years and held. It was the fourth time in four years that shares moved towards that $210 level and held. Clearly, we have a major level of interest to watch from a risk/reward set-up.

Shares hit extreme oversold levels in its relative strength index (RSI) in early March and have finally bounced. The rally back from oversold levels and a hold of key support should favor the bulls for now.

If you were to trade this into Wednesday afternoon’s earnings, you must watch that support level carefully. It has held time and again, and this would be a great area to dip into the stock with a stop-loss for protection just below support to minimize losses. Any positive reaction could see a fast snapback rally towards the 200-day moving average, which sits 35% above current levels. A simple mean reversion could equate to a nice return, while the stock remains in its longer-term downtrend.

ConAgra (CAG)

ConAgra, the parent company of Duncan Hines, Birds Eye, and Slim Jim, has struggled after earnings, as it has fallen five of the last six times it has reported.

Technically, shares sit in the middle of a range between its 50-day and 200-day moving averages. The consumer staple has held up relatively well compared to the overall market and has only declined -4.5% year-to-date. It pays a 5.3% dividend and is considered a safer haven in these turbulent times.

The $24.50/$25 level has acted as solid support and could be a good entry point given current market uncertainty. However, the upside has overhead resistance at the 200-day moving average and the $27.50/$28 level.

Overall, this may be a nice place to hide out during turbulent times, but the overall risk/reward is marginal, at best. It may be more rewarding to eat their products than to trade the stock.

One of the indicators that Carl Swenlin developed is the Silver Cross Index. It is one of the best participation indicators out there! Here’s how it works:

We consider a positive 20/50-day EMA crossover a “Silver Cross”. If a stock has a Silver Cross it has a bullish bias. The opposite of a Silver Cross is a Dark Cross. Stocks with a Dark Cross have a bearish bias.

The Silver Cross Index measures the percentage of stocks holding Silver Crosses. The current percentage on the Silver Cross Index is just 37% so this tells us that 63% have bearish biases. This condition suggests to us that the market has more downside to absorb.

The Silver Cross Index was nearing a Bullish Shift across its signal line, but instead has topped. It is likely to continue declining given less stocks are above their 20/50-day EMAs versus the Silver Cross Index percentage.

Participation measured by the percent of stocks above their key moving averages are all below our bullish 50% threshold. Stochastics have topped and the PMO topped Friday. The short-term rising trend has been broken. This looks like a textbook reverse flag formation that was confirmed with Friday’s decline. The minimum downside target of the pattern would put price near 480. This sure has the earmarks of a failed bear market rally.

Conclusion: The Silver Cross Index is at a very low 37% and has now topped beneath its signal line. Participation, as measured by the %Stocks > 20/50EMAs, is mediocre at best and reading below the Silver Cross Index. This looks like the end of a bear market rally based on the bear flag that was confirmed on Friday.

(Note: This chart is from our “Under the Hood” ChartList on DecisionPoint.com. We have these charts with the Silver Cross Index for all the major indexes, sectors and select industry groups. All subscriptions include access to these charts!)


The DP Alert: Your First Stop to a Great Trade!

Before you trade any stock or ETF, you need to know the trend and condition of the market. The DP Alert gives you all you need to know with an executive summary of the market’s current trend and condition. It not only covers the market! We look at Bitcoin, Yields, Bonds, Gold, the Dollar, Gold Miners and Crude Oil! Only $50/month! Or, use our free trial to try it out for two weeks using coupon code: DPTRIAL2. Click HERE to subscribe NOW!


Learn more about DecisionPoint.com:


Watch the latest episode of the DecisionPointTrading Room on DP’s YouTube channel here!


Try us out for two weeks with a trial subscription!

Use coupon code: DPTRIAL2 Subscribe HERE!


Technical Analysis is a windsock, not a crystal ball. –Carl Swenlin

(c) Copyright 2025 DecisionPoint.com


Disclaimer: This blog is for educational purposes only and should not be construed as financial advice. The ideas and strategies should never be used without first assessing your own personal and financial situation, or without consulting a financial professional. Any opinions expressed herein are solely those of the author, and do not in any way represent the views or opinions of any other person or entity.

DecisionPoint is not a registered investment advisor. Investment and trading decisions are solely your responsibility. DecisionPoint newsletters, blogs or website materials should NOT be interpreted as a recommendation or solicitation to buy or sell any security or to take any specific action.


Helpful DecisionPoint Links:

Trend Models

Price Momentum Oscillator (PMO)

On Balance Volume

Swenlin Trading Oscillators (STO-B and STO-V)

ITBM and ITVM

SCTR Ranking

Bear Market Rules


Friday’s overheated inflation data appears to have initiated a new downward leg for the major equity averages.  This could mean a confirmed bear flag pattern for the S&P 500, and potentially much further lows before this corrective period is complete.

A bear flag occurs during a downtrend phase, where price begins a brief countertrend rally of higher highs and higher lows.  This short-term uptrend swing formed by parallel trendlines represents a brief pause within the longer downtrend structure.  If and when the price breaks below the lower trendline, that confirms the bear flag pattern and suggests a continuation of the bear phase.  

A bear flag often occurs around the midpoint of the downtrend, which is why we can use the trend leading into the pattern as a way of projecting a minimum downside objective.  Based on the daily S&P 500 chart, and assuming a confirmed bear flag pattern this week, that would suggest a downside objective around 5200.

How else can we corroborate this indicator that implies a 16% drop from the February all-time high?  The good news is that patterns like this don’t happen in a vacuum, so let’s review how this analysis relates to other areas of the technical toolkit.

Here we can see that the swing low from earlier in March lined up almost perfectly with a 61.8% retracement of the August 2024 to December 2024 bull phase.  The subsequent bounce earlier this month drove the S&P 500 up to test its 200-day moving average from below, a level which coincided with the price gap formed around election day in November.

I always think of charts in terms of key price levels, what I call “lines in the sand”, so I can set alerts and focus on taking action only when the chart confirms a new trend.  In this case, the 5500 level seems to be the most important price point to monitor, as a violation of that support level would mean a breakdown through Fibonacci support as well as the March swing low.

Assuming a break below 5500, the S&P 500 would then have a clear path to a new downside objective in the 5100-5200 range.  The 5200 target is derived from the bear flag pattern described today, while the 5100 level is based on a longer-term Fibonacci structure using the October 2022 low.

It’s worth noting that none of these targets are absolute guarantees!  Only by analyzing trend, breadth, and momentum readings along the way down can we validate the likelihood of further deterioration.  I sign off every episode of my daily market recap show with the tagline, “It’s always a good time to own good charts.”  Based on this week’s bear flag pattern, the S&P 500 just isn’t a good chart.

One more thing… We interviewed options expert Jay Soloff last week on the Market Misbehavior podcast in what ended up being a masterclass on the VIX.  If you’ve ever wondered what the VIX represents and how investors can use it to assess market conditions, you should make the time to listen in!


RR#6,

Dave

PS- Ready to upgrade your investment process?  Check out my free behavioral investing course!

David Keller, CMT

President and Chief Strategist

Sierra Alpha Research LLC

Disclaimer: This blog is for educational purposes only and should not be construed as financial advice.  The ideas and strategies should never be used without first assessing your own personal and financial situation, or without consulting a financial professional.  

The author does not have a position in mentioned securities at the time of publication.    Any opinions expressed herein are solely those of the author and do not in any way represent the views or opinions of any other person or entity.

The performance profile for 2025 says a lot about the state of the market. Commodity-related ETFs are leading, non-cyclical equity ETFs are holding up the best and cyclical names are performing the worst. Clearly, this is not a positive picture for the stock market. This report will show how to interpret the performance profile and separate the leaders from the laggards using a ChartList.

The following images come from the summary view of the TrendInvestorPro core ETF ChartList, which has 72 ETFs covering equities, commodities, bonds and crypto. The period setting is year-to-date (YTD) with the first example sorted by the year-to-date percentage change (% CHG) to see the leaders at the top. I added the SMA(200) column to see how far above/below each ETF is from its 200-day SMA. There are three performance takeaways.

First takeaway: commodity ETFs are leading. The image below shows the 10 ETFs with the highest year-to-date gains. Nine of the top ten are commodity-related ETFs. We are seeing strength in precious metals (gold, silver), industrial metals (copper, copper miners) and integrated energy (XLE). Broady speaking, this tells us that commodities are preferred over stocks. 

TrendInvestorPro covered the leading equity and commodity ETFs in our reports/videos this week. We saw breakouts in Aerospace-Defense and continued leadership in Insurance. Gold has blue skies as it trades near all-time highs, while Copper is looking dicey as it goes parabolic. Click here to take a trial and get immediate access.

Second takeaway: Equity ETFs from non-cyclical groups show relative strength. These include Aerospace-Defense (ITA), Insurance (KIE), Healthcare (XLV), Telecom (IYZ) and MLPs (AMLP). Non-cyclical groups are more insulated from economic fluctuations and often hold up better during periods of economic uncertainty.

Third takeaway: Equity ETFs from cyclical groups show the most pronounced downtrends. The example below is sorted by percent above 200-day SMA. The furthest below their 200-day SMAs are at the top and showing the most pronounced downtrends. Here we see ETFs related to Housing (ITB, XHB), Retail (XRT) and Semiconductors (SMH, SOXX). This is not the performance profile of a bull market. 

Need an organized and focused ETF ChartList that covers all bases? Our Core ETF ChartList has 72 names organized in a logical top-down manner. It includes 59 equity ETFs, 4 Treasury bond ETFs, 7 commodity ETFs and 2 crypto ETFs. Sign up for a trial at TrendInvestorPro and I will share this ChartList.

/////////////////////////////////////////////

Wednesday’s stock market price action revealed a caution sign, and with it, any hope that rose from Monday’s price action just got buried. The Tech sector sold off, with the Nasdaq Composite ($COMPQ) falling over 2%.

The chart of $COMPQ indicated hesitation. Of the three broader indexes, it was the one that didn’t cross above its 200-day simple moving average (SMA), and its breadth wasn’t showing signs of expanding. The Dow Jones Industrial Average ($INDU) still holds on to its position above its 200-day SMA and 21-day EMA.

The S&P 500 is a concerning chart. The index crossed above its 200-day SMA on Monday; then, on Tuesday, there was a doji candlestick indicating indecision among investors. Then comes Wednesday, and we see a wide-range down day that closed well below the midpoint of Monday’s trading range. This satisfied the conditions for an evening doji star, which is a bearish reversal pattern. In addition, the index wasn’t able to close above its January low. This doesn’t leave a warm, fuzzy feeling.

FIGURE 1. BEARISH REVERSAL IN THE S&P 500 DAILY CHART? The evening doji star is an indication of a bearish reversal. Will this hold or will the pattern fail? It’s something to watch for as tariff concerns remain front and center. Chart source: StockCharts.com. For educational purposes.

Consumer Discretionary Sells Off

The back and forth with tariffs was the main cause of Wednesday’s selloff. The news of President Trump prepping to sign an auto tariff statement after the market closes elevated investor uncertainty. The automobile industry was the worst performer in the Consumer Discretionary sector (see MarketCarpet below).

FIGURE 2. CONSUMER DISCRETIONARY SECTOR’S MARKETCARPET. The automobile industry was the worst hit in this sector. After the tariff announcement on Wednesday, the sector could see further selling. Image source: StockCharts.com. For educational purposes.

Tesla, Inc. (TSLA), the largest weighted stock in the Automobile sub-industry, fell 5.58%. There were many other auto manufacturers such as Toyota Motor (TM), Ferrari (RACE), General Motors (GM), and Honda Motor Co. (HMC), who experienced a similar fate.

Mr. Market didn’t know the tariff details before the close, so the selloff was in anticipation of 25% tariffs being implemented. At around 5:30 pm EDT, President Trump announced the implementation of 25% tariffs on autos manufactured outside of the U.S. Shares of Ford Motor Co. (F), General Motors (GM), and Stellantis (STLA) were trading lower after Wednesday’s close. Don’t be surprised if Thursday is a volatile trading day.

Semis Tumble

Things weren’t so rosy in AI land, either. Microsoft, Inc. (MSFT) scaled back on its data center buildouts, which didn’t help tech stocks. The Technology sector was the worst-performing S&P sector on Wednesday.

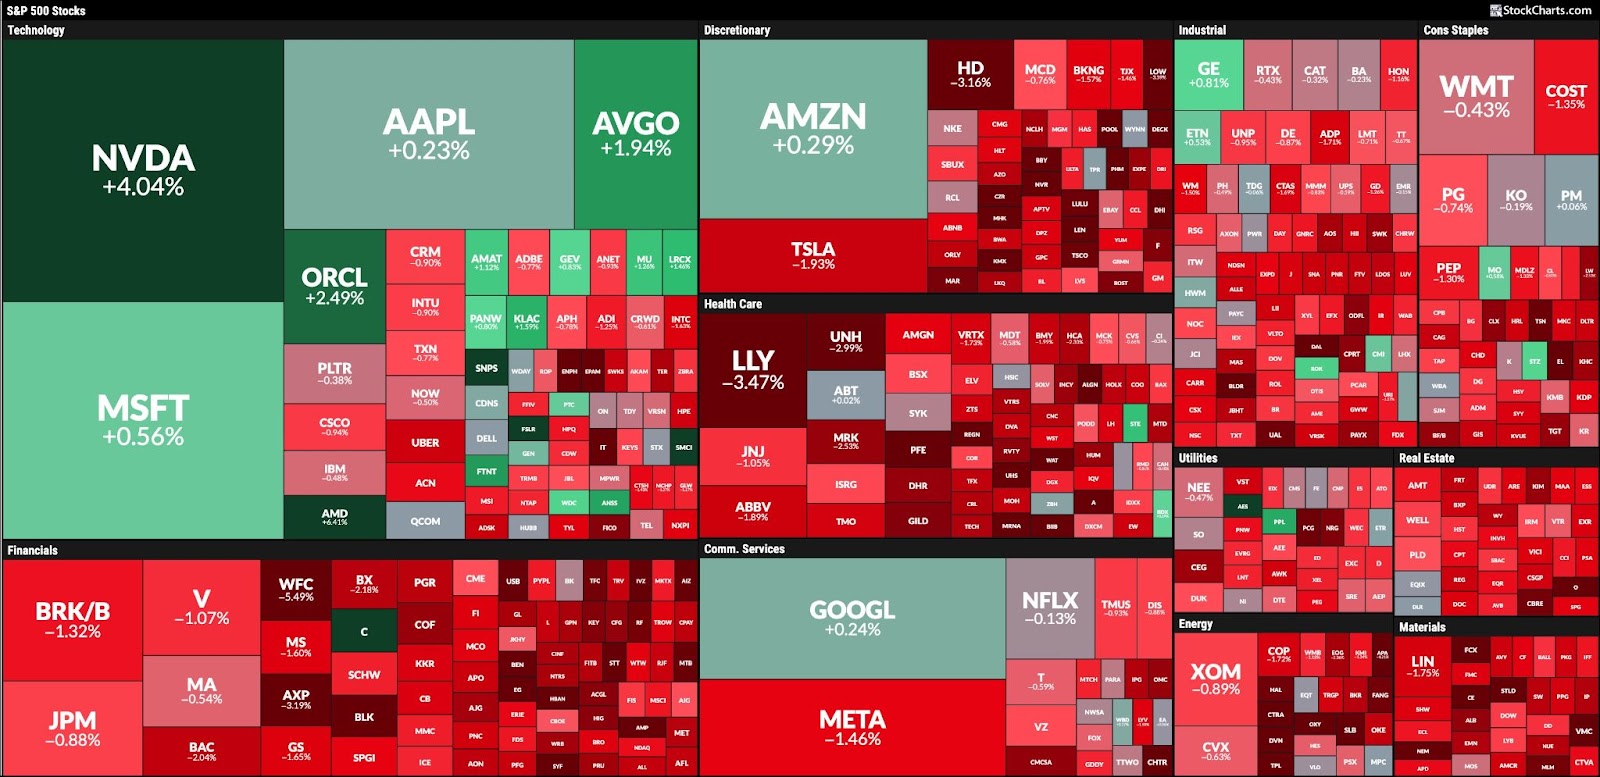
The Technology sector MarketCarpet below gives a good picture of the magnitude of the selloff. Semiconductors were the worst hit, with NVIDIA Corp. (NVDA), Broadcom, Inc. (AVGO), and Taiwan Semiconductor Mfg. (TSM) seeing significant declines.

FIGURE 3. TECHNOLOGY SECTOR MARKETCARPET. The Technology sector was the hardest hit on Wednesday. As you can see, it was a sea of red with the large-cap weighted stocks seeing significant selloffs. Chart source: StockCharts.com. For educational purposes.

What a difference a day makes. The Cboe Volatility Index ($VIX) is inching higher after its slide since March 11. It’s back above 18 indicating that fear is back on the table.

Fasten Your Seatbelts

The rest of this week could be volatile. Keep your eyes on the macro picture. Treasury yields held on, but could rise further on Wednesday. As a result, the U.S. dollar could strengthen against the Japanese yen. If inflation expectations and concerns about economic growth rise, precious metals could shine.


Disclaimer: This blog is for educational purposes only and should not be construed as financial advice. The ideas and strategies should never be used without first assessing your own personal and financial situation, or without consulting a financial professional.

After a blistering snapback rally over last the week, a number of the Magnificent 7 stocks are actively testing their 200-day moving averages.  Let’s look at how three of these leading growth names are setting up from a technical perspective, and see how this week could provide crucial clues to broader market conditions into April.

META Remains Above an Upward-Sloping 200-Day

While most of the Mag 7 names already broke below their 200-day moving averages, Meta Platforms (META) is one of the few that have remained above this key trend indicator.  We can see a very straightforward downtrend of lower lows and lower highs from the mid-February peak around $740 to last week’s low around $575.

With the recent bounce, META has now established clear support at the 200-day as well as the December 2024 swing low.  This “confluence of support” suggests that a break below $575 would confirm a new downtrend phase for this leading internet stock.  Only if we saw a break back above the 50-day moving average around $650 would we consider an alternative bullish scenario here.

Will AMZN Hold This Long-Term Trend Barometer?

While META is still holding its 200-day moving average, Amazon.com (AMZN) broke below its 200-day back in early March.  The recent bounce off $190 has pushed AMZN back above the 200-day this week, with the Monday and Friday lows sitting almost perfectly on this long-term trend indicator.

The most important question here is whether Amazon will be able to hold above its 200-day, but given the meager momentum readings, a failure here seems more likely.  Note how despite the recent uptrend move, the RSI has remained below the 50 level through mid-week.  This lack of upside momentum indicates a lack of willing buyers, and suggests a breakout here as an unlikely outcome.  

Similar to the chart of META, we’re watching for any move above the 50-day moving average, which would tell us to consider the recent upswing to have further upside potential.  

Failure Here Would Signal Renewed Weakness for TSLA

Now we come to one of the weaker charts out of the mega cap growth names, Tesla Inc. (TSLA).  Tesla lost over half its value from a peak around $480 in mid-December 2024 to its March 2025 low around $220.  This week’s pop higher has pushed TSLA right up to the 200-day moving average, but no further.

Tesla was one of the first Magnificent 7 stocks to set a peak, as many of these growth names continued to make higher highs into early 2025.  TSLA finally registered an oversold condition for the RSI in late February, before a bounce in mid-March which pushed the RSI back above the crucial 30 level.

When a stock fails to break above the 200-day moving average, as we see so far this week for Tesla, it means that there just isn’t enough buying power present to reverse the longer-term downtrend phase.  Until and unless TSLA can push above the 200-day, we’d much rather look for opportunities elsewhere.  

As legendary investor Paul Tudor Jones is quoted, “Nothing good happens below the 200-day moving average.”  Given the recent upswings for these key growth stocks, and their current tests of this long-term trend barometer, investors should be prepared for a failure at the 200-day and brace for what could come next for the Magnificent 7.


RR#6,

Dave

PS- Ready to upgrade your investment process?  Check out my free behavioral investing course!

David Keller, CMT

President and Chief Strategist

Sierra Alpha Research LLC

Disclaimer: This blog is for educational purposes only and should not be construed as financial advice.  The ideas and strategies should never be used without first assessing your own personal and financial situation, or without consulting a financial professional.  

The author does not have a position in mentioned securities at the time of publication.    Any opinions expressed herein are solely those of the author and do not in any way represent the views or opinions of any other person or entity.

Gold at $3,100 and silver at $50? That might’ve sounded wild a year or two ago, but it’s now the upper trajectory some analysts are eyeing. With consumer confidence cratering to a 12-year low, inflation expectations rising, and central banks hoarding bullion like it’s the latest fashion, gold is holding firm above $3,000 per ounce and silver is knocking on $34.

There’s another thing to consider: the gold-to-silver ratio is still high, reaching 91:1 on Monday and 89.7 on Tuesday, hinting that silver may be massively undervalued. If the ratio snaps back to historical norms, silver could explode past $40, even $50, while gold edges toward $3,100 or higher.

FIGURE 1. CHART OF GOLD/SILVER RATIO. The historical average is at 65:1, well below the data on the chart. Any level above 87 signals a potential buying opportunity.

Note how the price of silver, namely its rallies highlighted in the shaded area below the chart, is responding to the ratio. I’m going to cover this in more detail below, as the ratio serves not only as guidance but also as an important component for an entry setup.

So, if analysts are targeting $3,100, where is gold now, and what setup might it present? Take a look at a daily chart.

FIGURE 2. DAILY CHART OF GOLD. Gold is pulling back, an ideal setup for those who are bullish on the yellow metal.

Gold has pulled back from its all-time high of $3,056, coinciding with an overbought reading in the Relative Strength Index (RSI). The Quadrant Lines give you a wide range of support levels for entry.

  • The second quadrant, containing the previous swing high at $2,960, may see some bulls jumping in.
  • Below that, the third and fourth quadrants coincide with the two previous swing lows near $2,890 and $2,840.

Staying within and bouncing from these quadrants could signal continued strength in the current swing. Below that level would indicate the end of the current uptrend, and whether the price reverses or falls into a range, you will likely find plenty of support at the two areas highlighted in magenta.

Next, take a look at a daily chart of silver.

FIGURE 3. DAILY CHART OF SILVER. According to the gold/silver ratio, silver may be poised for another leg up.

Take a look at the green circles highlighting where the gold/silver ratio exceeded 89. These are relatively high levels, considering that the average ratio reading is between 65 to 75 depending on the historical average you’re measuring. As soon as the ratio falls below that level, silver tends to rally. You see this twice in January, plus once in February and March; now that the ratio has risen above this level once again, will silver rally in response? That’s the big question, and one you should keep focused on.

The $40–$50 target range that many analysts are eyeing is still a distance away. The RSI, holding above the 50 line, suggests there’s room for more upside before hitting overbought territory.

If you’re bullish on silver, hoping for it to reach the projected levels above $40 and toward $50, here’s what you should focus on:

  • Silver would need to break above resistance levels at $34.25, the most recent swing high, and $34.75, which would see the grey metal enter its 12-year high territory, paving the way to $40 and above.
  • If silver pulls back, it should stay above (ideally) $32.75 and $31.75.
  • A close below $31.75, even if it finds support at the next swing low at $30.75, would signal weakness and likely invalidate the current uptrend.

What does this mean for investors using ETFs like SLV and GLD?

As a stock investor, you’re likely not seeking exposure to precious metals in the futures or spot market. The most commonly traded metals-backed options are the following ETFs:

  • SPDR Gold Shares (GLD), which you could learn more about in the StockCharts’ Symbol Summary; and
  • iShares Silver Trust (SLV), whose info is also available in the Symbol Summary.

The prices will differ as ETFs are structured differently. With that said, what do these price moves mean for the ETFs?

  • If gold climbs to $3,100 an ounce, GLD—designed to track 1/10th of an ounce—could be trading in the $310 to $330 range.
  • If silver makes a run at $50, SLV could surge right alongside it, potentially hitting $50 per share.

If you’re looking to ride the metals rally without holding physical bullion, these ETFs offer a direct and highly liquid way to gain exposure. And if silver’s historical catch-up to gold kicks in, SLV could potentially deliver the bigger upside.

At the Close

Gold and silver are both showing signs of strength, backed by macroeconomic pressure, historical ratios (at least for silver), and the overall technical context. Silver could be setting up for a catch-up move that might outperform gold in percentage terms. So, stay nimble, watch your levels, and remember that when silver moves, it often moves fast.


Disclaimer: This blog is for educational purposes only and should not be construed as financial advice. The ideas and strategies should never be used without first assessing your own personal and financial situation, or without consulting a financial professional.