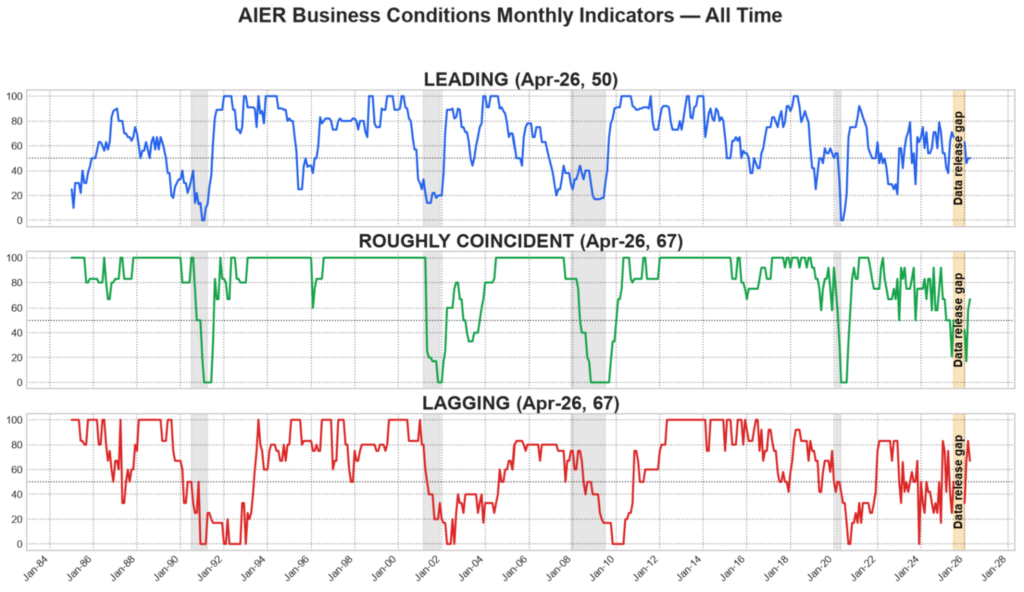
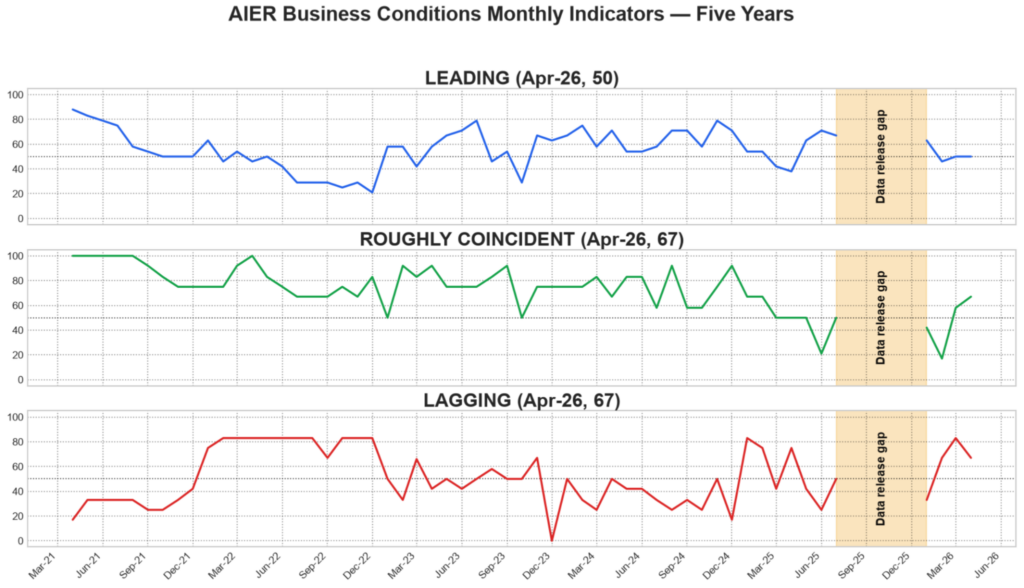
The April 2026 AIER Business Conditions Monthly (BCM) points to a still-mixed but somewhat more balanced economic picture. The Leading Indicator held steady at 50, suggesting that forward looking conditions remain neither clearly expansionary nor clearly contractionary. The Roughly Coincident Indicator improved to 67 from 58, indicating firmer current activity than in March. The Lagging Indicator eased to 67 from 83, but remained solidly expansionary, suggesting that slower-moving measures continue to show residual strength even as some momentum has moderated.
LEADING INDICATOR (50)
The Leading Indicator came in at 50, with six of 12 components improving, none unchanged, and six declining.
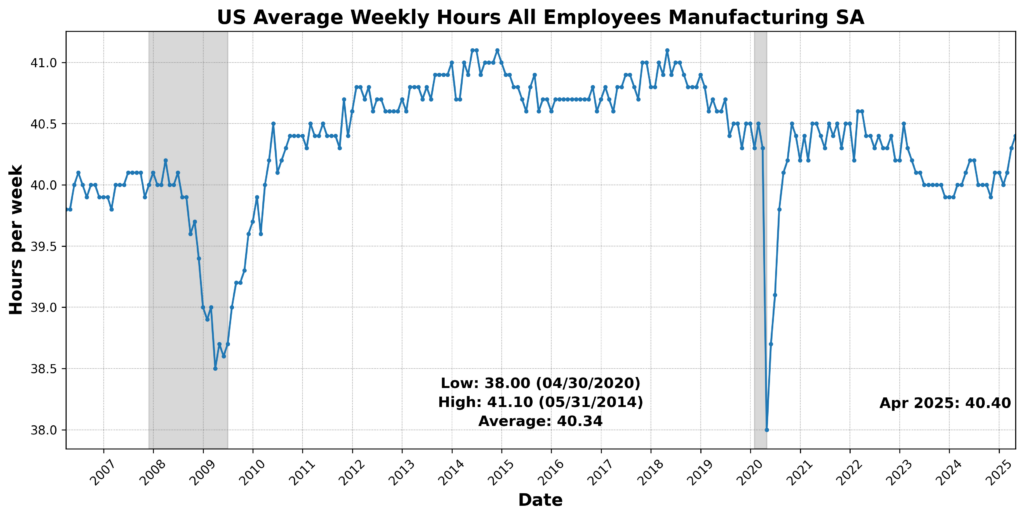
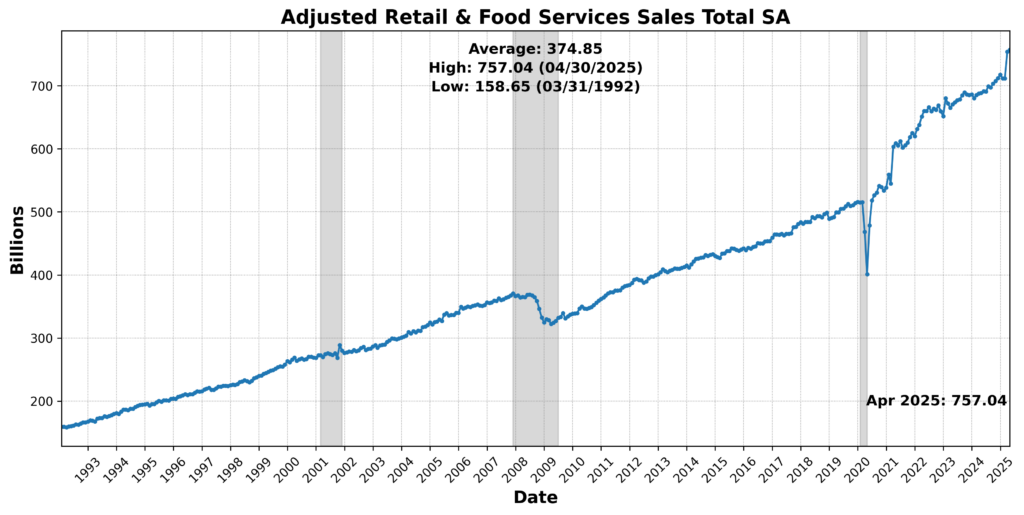
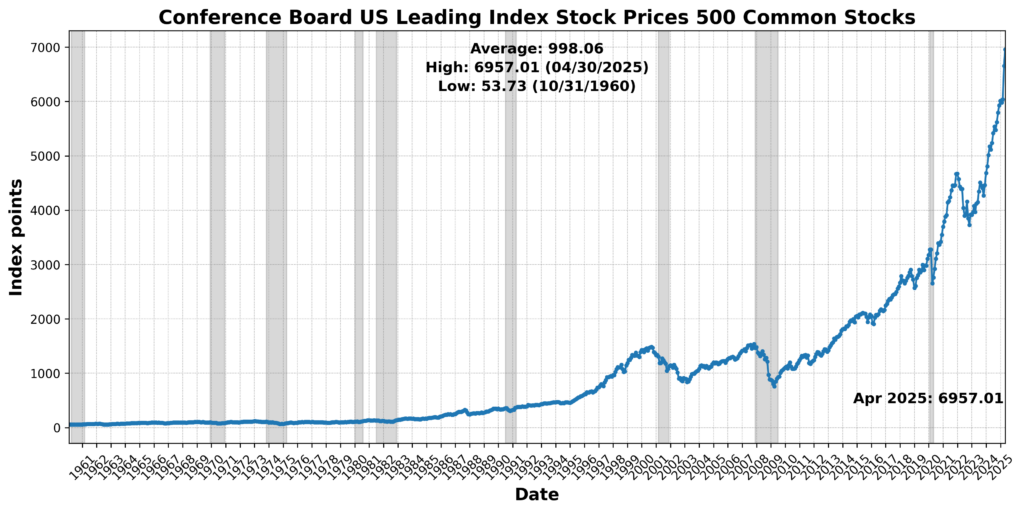
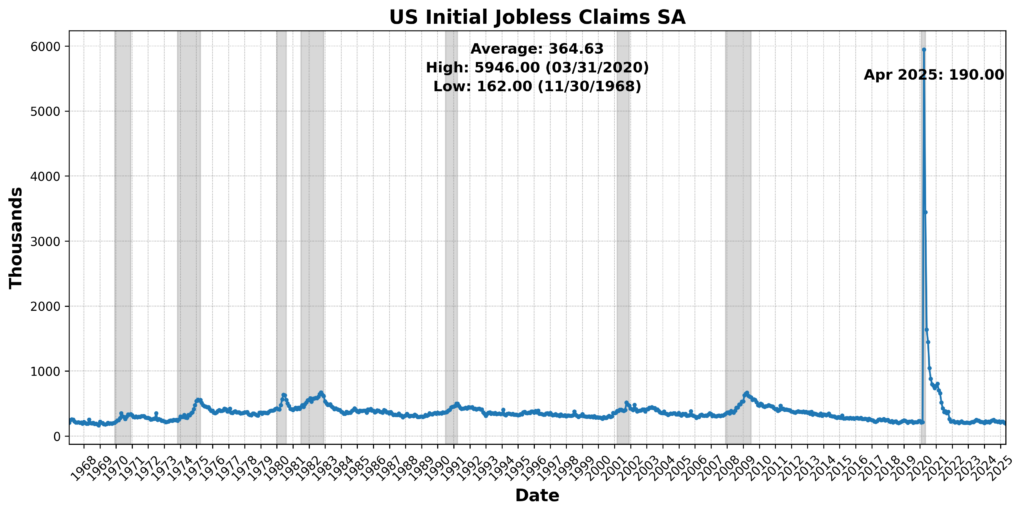
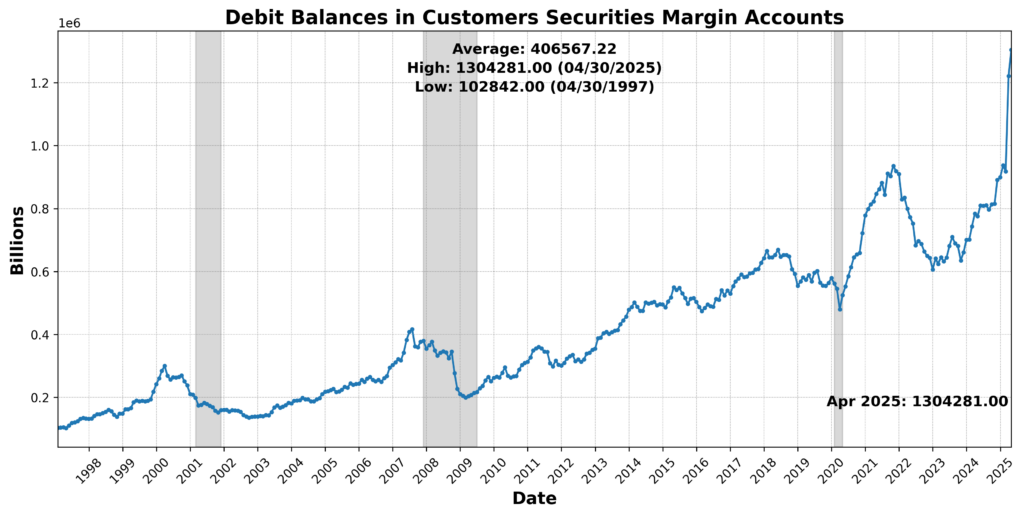
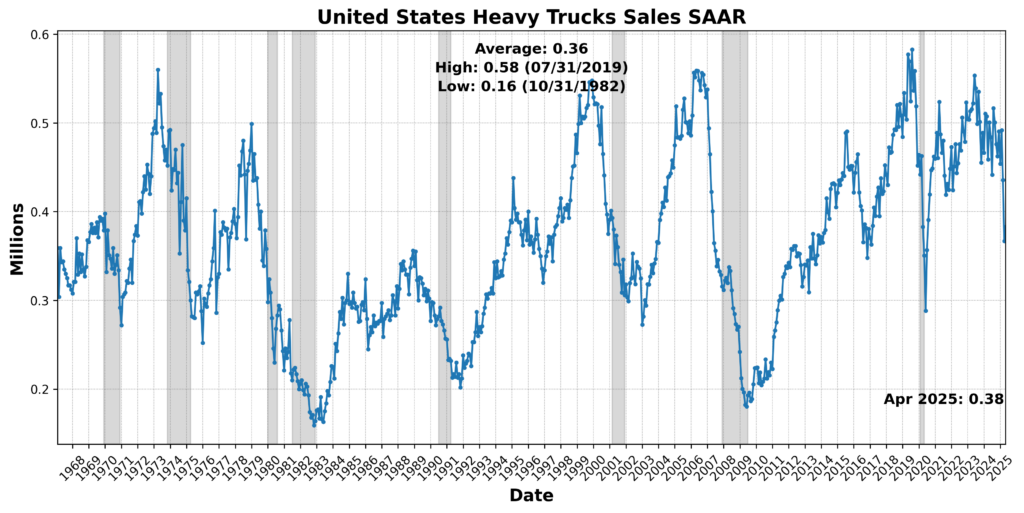
Positive contributions came from a mix of labor, financial, market, and demand-sensitive measures. US Average Weekly Hours All Employees Manufacturing SA rose 0.2 percent. US Initial Jobless Claims SA declined 6.4 percent and was scored positively after inversion. The Conference Board US Leading Index Stock Prices 500 Common Stocks increased 4.5 percent, while Adjusted Retail and Food Services Sales Total SA rose 0.4 percent. United States Heavy Trucks Sales SAAR increased 4.4 percent, and Debit Balances in Customers’ Securities Margin Accounts rose 6.8 percent.
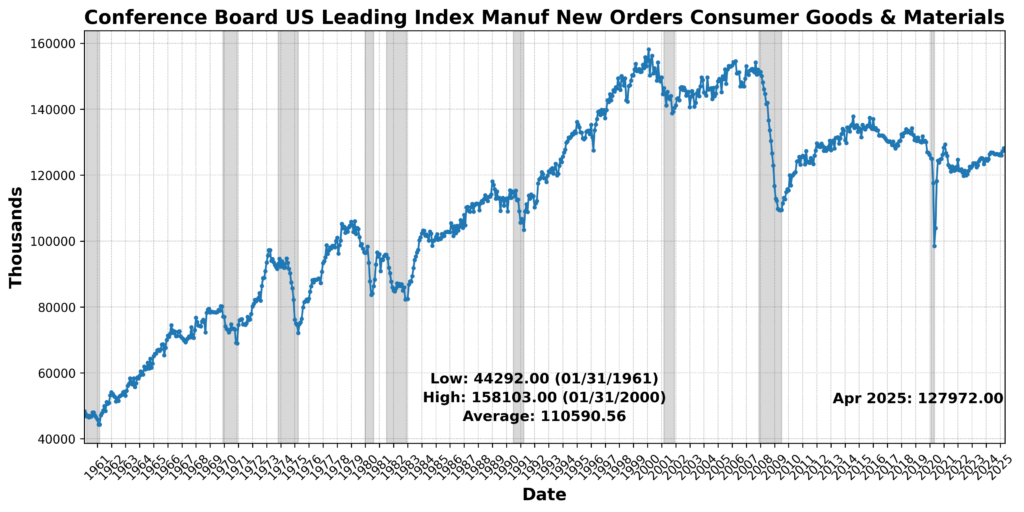
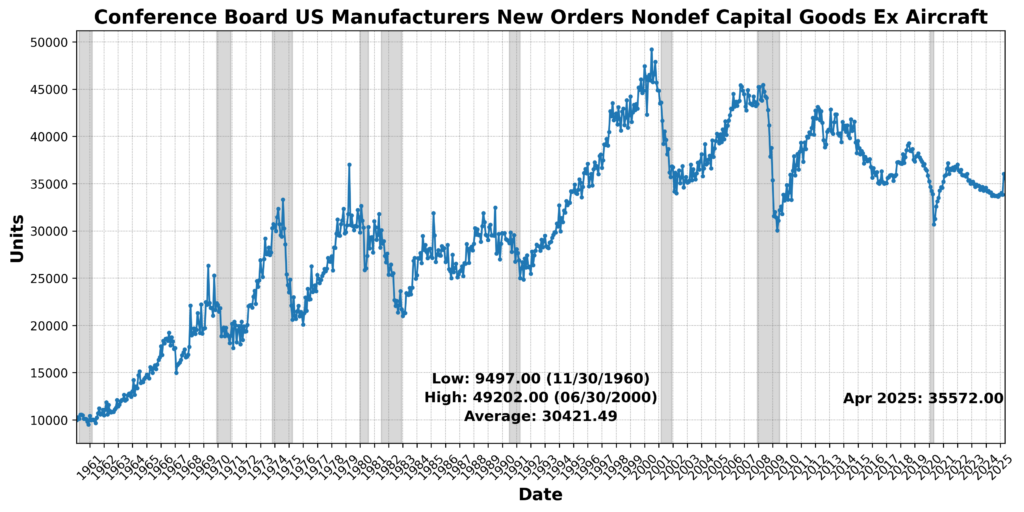
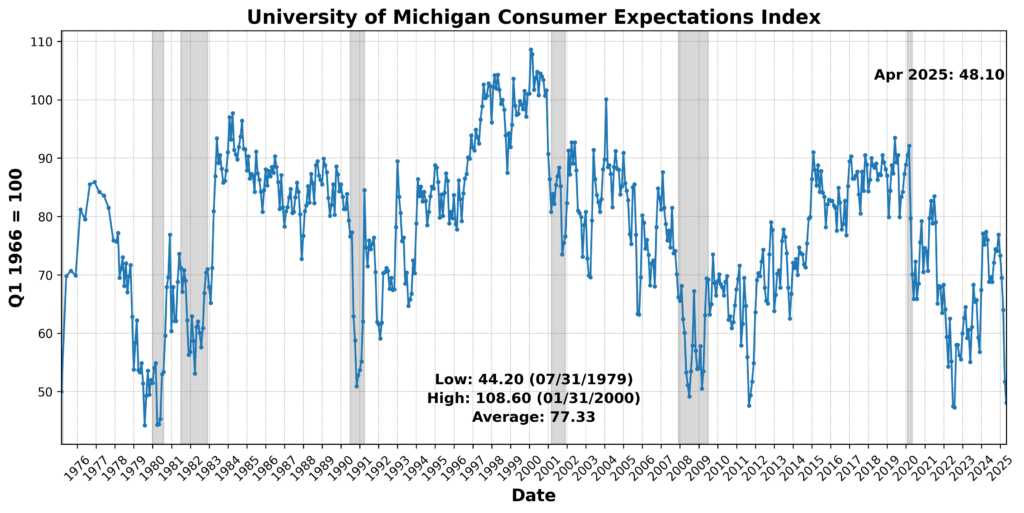
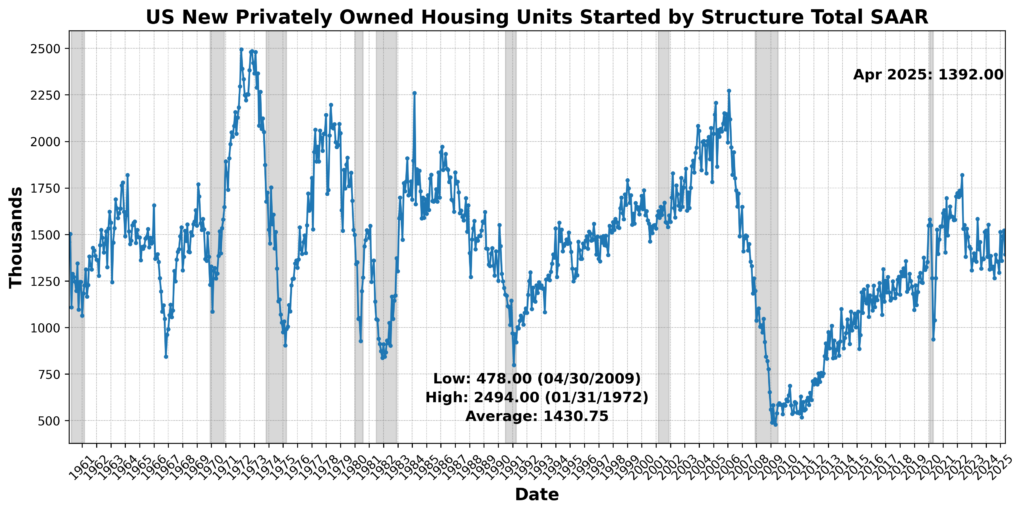
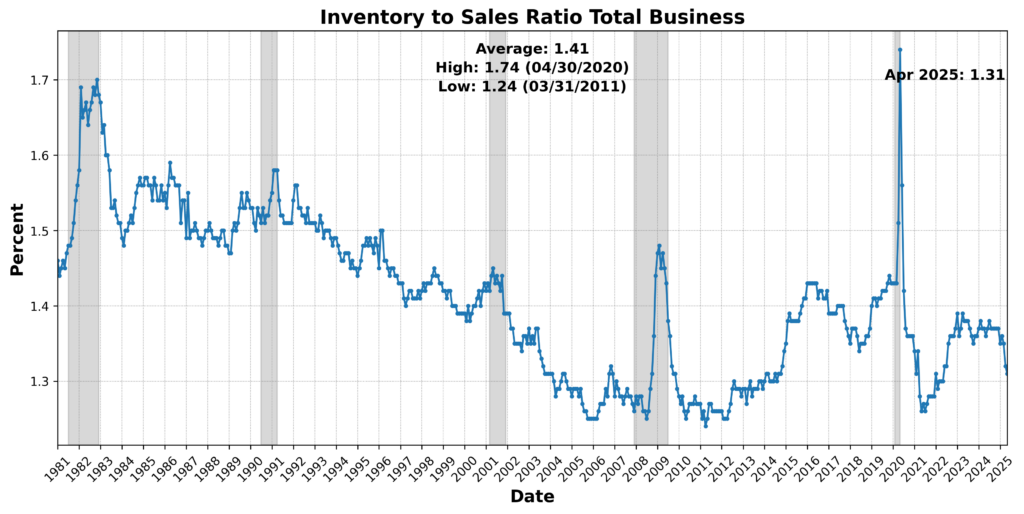
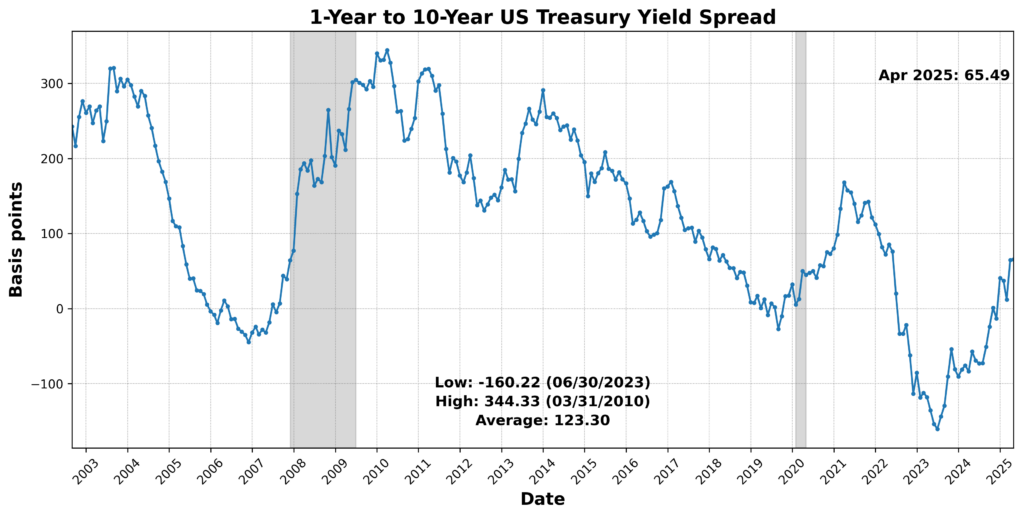
Those gains were offset by weakness in several important forward-looking areas. The University of Michigan Consumer Expectations Index fell 7.0 percent, pointing to softer household expectations. Conference Board US Leading Index Manufacturers’ New Orders Consumer Goods and Materials slipped 0.2 percent, and Conference Board US Manufacturers New Orders Nondefense Capital Goods Ex Aircraft declined 1.3 percent. US New Privately Owned Housing Units Started by Structure Total SAAR dropped 8.5 percent, while the Inventory-to-Sales Ratio Total Business declined 0.8 percent. The 1-Year to 10-Year US Treasury Yield Spread widened 1.3 percent, but because that measure is inverted in the BCM scoring system, it was scored negatively.
Taken together, the leading components suggest a forward-looking environment that remains divided. Financial market measures, retail activity, heavy truck sales, and initial claims provided support, but weakness in consumer expectations, housing starts, new orders, and the yield curve signal prevented the Leading Indicator from moving above neutral.
ROUGHLY COINCIDENT INDICATOR (67)
The Roughly Coincident Indicator registered 67, with four of six components improving and two declining.
Current activity showed broad enough strength to move the index higher. Conference Board Coincident Manufacturing and Trade Sales rose 0.2 percent, while Conference Board Consumer Confidence Present Situation SA increased 0.2 percent. US Industrial Production SA advanced 0.9 percent, representing one of the stronger coincident gains, and US Employees on Nonfarm Payrolls Total SA edged higher by 0.1 percent.
Offsetting those gains, Conference Board Coincident Personal Income Less Transfer Payments declined 0.4 percent, and the US Labor Force Participation Rate SA slipped 0.2 percent. Those declines suggest that while production, payrolls, sales, and present-situation sentiment improved, the income and participation backdrop remained somewhat weaker.
Overall, the roughly coincident data point to a firmer current environment than in March. The move from 58 to 67 reflects a modest broadening in real-time activity, though the improvement is not uniform and remains tempered by softness in income and labor force participation.
LAGGING INDICATOR (67)
The Lagging Indicator stood at 67, with four of six components improving and two declining.
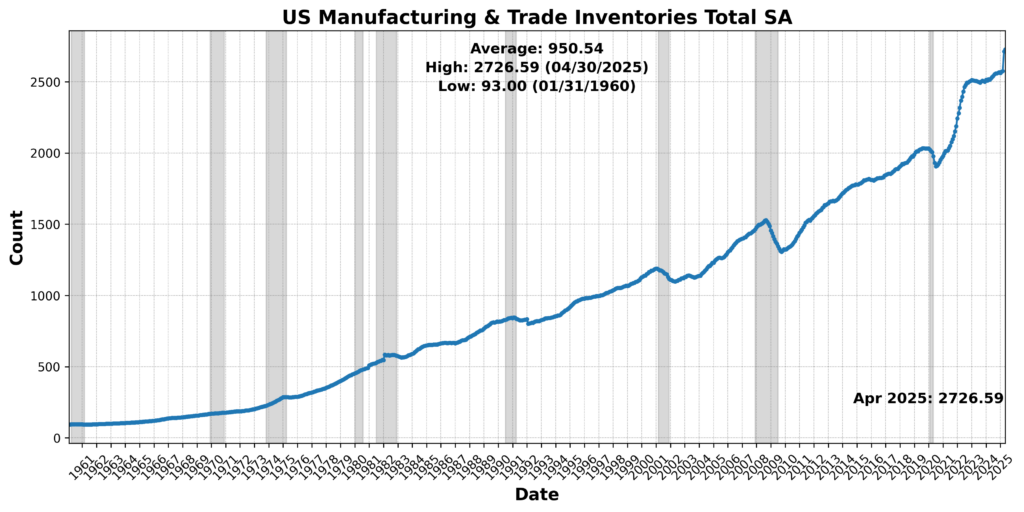
Several slower-moving measures continued to show strength. US CPI Urban Consumers Less Food and Energy Year over Year NSA rose 7.7 percent, indicating renewed pressure in the core inflation measure. Conference Board US Lagging Average Duration of Unemployment fell 3.6 percent and was scored positively after inversion. Conference Board US Lagging Commercial and Industrial Loans increased 0.1 percent, and US Manufacturing and Trade Inventories Total SA rose 0.5 percent.
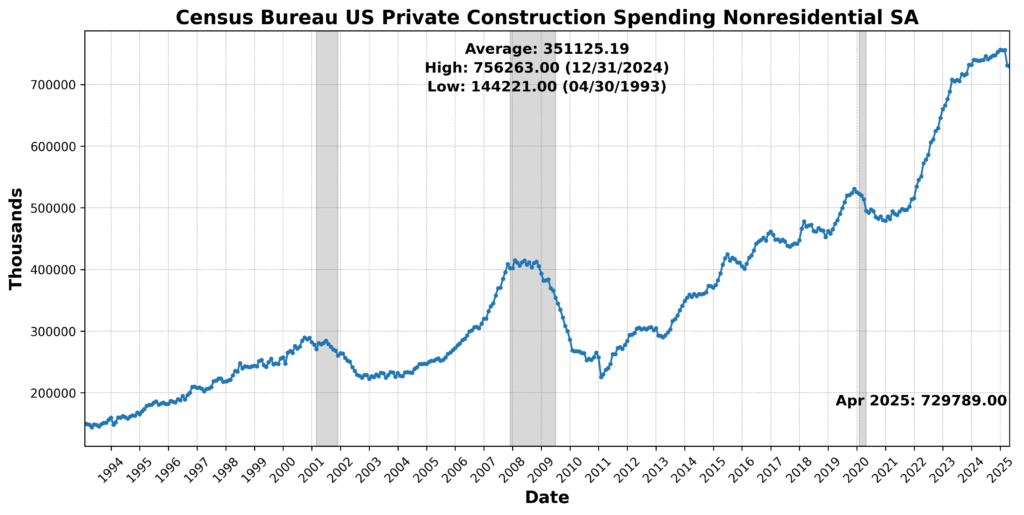
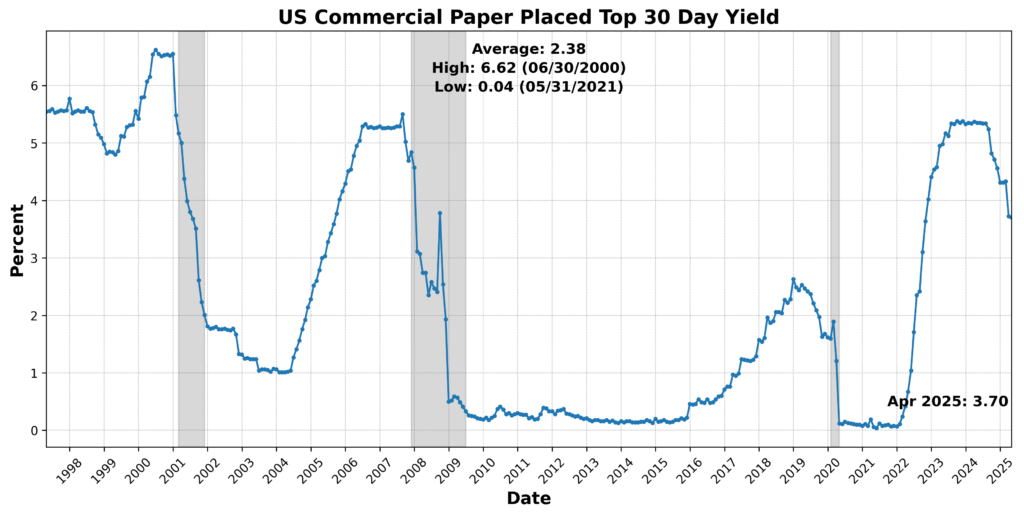
Two components weakened. US Commercial Paper Placed Top 30 Day Yield declined 0.5 percent, and Census Bureau US Private Construction Spending Nonresidential SA slipped 0.2 percent. Those declines point to softer short-term credit conditions and mild weakness in nonresidential construction spending.
The lagging data remain expansionary, though less strongly so than in March. The decline from 83 to 67 suggests some easing in the strongest backward-looking signals, but the category continues to reflect underlying firmness in prices, inventories, commercial lending, and unemployment-duration dynamics.
April’s BCM results still describe an uneven economy, but not one that’s broadly rolling over: the Leading Indicator stayed at 50 (neutral), the Roughly Coincident Indicator climbed from 58 to 67 (firmer current activity), and the Lagging Indicator cooled from 83 to 67 while remaining expansionary (still-solid trailing conditions). Relative to March, the story is mainly a shift away from unusually strong lagging strength toward a better coincident read—smoother than last month, but not yet a clean, broad-based pickup.
DISCUSSION (May/June 2026)
Recent inflation data point to a complicated but somewhat less alarming price environment, with consumer prices showing signs of restraint even as upstream pressures remain firm. May’s CPI report was softer beneath the headline than the energy-driven increase suggested: core inflation slowed, the breadth of price increases narrowed, food inflation moderated, shelter cooled from April’s pace, and several discretionary goods and services categories showed evidence that consumers are resisting further price hikes. Gasoline and airfares remained important sources of pressure tied to the Iran conflict and higher fuel costs, while core goods softened overall, apart from scattered strength in metal-sensitive categories such as appliances, sporting goods, and jewelry. Producer price data complicate that benign consumer-side message, however, as May’s PPI showed costs still moving through the production pipeline in energy, transportation, finance-related services, manufacturing inputs, and commodity-sensitive components. Some of those pressures have not yet reached consumers, implying either continued margin absorption by firms or delayed pass-through later this summer, while PPI components feeding into the Fed’s preferred PCE measure point to a firmer reading through airfares, healthcare services, and portfolio management fees. The result is not broad inflation reacceleration so much as an uneven handoff: consumer caution, weak housing demand, and fading tariff pass-through are restraining retail prices, but producer-side costs and energy shocks keep the Fed from declaring the inflation problem resolved.
Labor market data have turned more constructive than earlier in the year, though the improvement remains uneven. May payroll growth came in well above expectations, prior months were revised higher, and gains were concentrated in leisure and hospitality, health care, local government, construction, and a modest rebound in manufacturing, while financial activities, information, and parts of professional and business services remained weak. The unemployment rate held broadly steady, participation was unchanged, and wage growth stayed firm without showing renewed acceleration. ADP’s private payroll measure and low initial claims reinforced the view that employers are still adding workers and layoffs remain contained. Beneath the headline, however, the labor market looks more stable than broadly resurgent: job openings rose sharply in April, but the increase was concentrated heavily in professional and business services, while vacancies declined in several more cyclically sensitive areas. With quits lower, layoffs subdued, and continuing claims contained, labor conditions appear characterized by selective hiring and reduced worker mobility rather than rapid churn. For the Federal Reserve, firmer payroll gains and limited layoffs reduce the urgency for rate cuts, but the narrow breadth of hiring and uneven sectoral demand argue against treating the labor market as unambiguously tight.
Manufacturing and goods sector data improved notably in May and June, though some of the strength appears tied to supply concerns and inventory rebuilding rather than a purely organic acceleration in final demand. The ISM Manufacturing Index rose to its strongest level in several years, supported by stronger domestic and export orders, rising backlogs, and faster production as firms worked to meet demand amid lean inventories. S&P Global’s June survey reinforced that improvement, with factory activity reaching its strongest level since 2022 and new orders advancing at the fastest pace in more than four years. Still, the details point to caution: manufacturers sharply increased input purchases and built stockpiles rapidly, suggesting precautionary behavior amid supply chain fears, while fuel costs, tariffs, metals, semiconductors, supplier delays, and elevated materials prices continue to cloud the outlook.
The services sector also expanded in May and June, but the underlying message was less reassuring than the headline gains suggested. The ISM Services Index rose on stronger new orders, yet export orders and backlogs softened, inventories increased more quickly, employment contracted slightly faster, and prices paid reached their highest level since mid-2022. S&P Global’s June survey showed some improvement in services activity, helped in part by World Cup-related demand and better news from the Middle East, but growth remained subdued relative to manufacturing as high prices and weak consumer confidence continued to weigh on demand. Overall, services remain a source of expansion, but not an unambiguous offset to broader risks: activity is still positive, yet soft hiring, rising prices, and fragile demand leave the sector vulnerable if higher costs or weaker confidence begin to restrain discretionary spending.
Consumer and business sentiment moved in opposite directions in late May and early June, but both remained highly sensitive to inflation, fuel costs, and policy uncertainty. The University of Michigan survey showed a modest improvement in consumer sentiment, helped by lower gasoline prices and some easing in inflation expectations. Consumers assessed both current conditions and the near-term outlook somewhat more favorably, while long-run inflation expectations moved lower — a development that should offer the Federal Reserve some reassurance. Even so, sentiment remains weak in absolute terms: households continue to view inflation as a greater near-term risk than unemployment, buying conditions for homes deteriorated, and plans for large purchases remain subdued despite small improvements for vehicles and household durables.
Small-business sentiment softened, reflecting a more difficult operating environment for firms exposed to rising input costs and uneven demand. The National Federation of Independent Business (NFIB) Index slipped in May as uncertainty stayed elevated, pricing pressures intensified, and supply-chain disruptions continued to affect a large share of firms. Business owners reported more difficulty passing higher costs through to customers, particularly as fuel prices became more volatile, and that appears to be weighing on plans for both capital spending and hiring. While recent profit trends improved somewhat, forward-looking indicators were weaker: capex intentions fell to very low levels, and hiring plans dropped to their weakest reading since 2020. Taken together, the sentiment data point to an economy in which consumers are slightly less pessimistic than they were, but firms remain cautious, cost sensitive, and reluctant to commit to expansion until the inflation and policy backdrop becomes clearer.
Retail and consumption data suggest that households continued to spend at a solid pace in May despite higher gasoline prices and elevated borrowing costs, with sales gains spread across most categories and particular strength in autos, gasoline stations, and online spending. The control group also advanced firmly, pointing to a consumer sector that remains resilient, though the report was supported by nominal price effects, larger-than-usual tax refunds, a rising stock market, and deal-seeking behavior rather than a clear easing of household constraints. Beneath the headline, the picture remains bifurcated: higher income households appear to be carrying much of the spending momentum, while lower income consumers remain pressured by tight budgets, weaker real wage growth, elevated borrowing costs, and a lower saving rate. Online retail strength suggests shoppers are becoming more selective and promotion-sensitive, with AI-powered shopping tools potentially becoming a larger influence over time. For now, sustaining consumption into the summer will depend less on one strong retail print than on labor market conditions, real disposable income growth, and whether households can continue absorbing higher energy prices without cutting back on discretionary purchases.
Industrial production and capex data show a goods-producing sector with pockets of real strength, but not a broad manufacturing revival. Total industrial production rose only slightly in May, while manufacturing output was essentially flat after a strong April, as gains in durable goods were offset by weakness in nondurables such as chemicals and petroleum products. The stronger areas were tied to business equipment, data center construction, onshoring, defense and space equipment, and energy production, with oil and gas drilling responding to higher prices. Durable goods output improved broadly, and business equipment production continued to advance, suggesting that capex plans remain intact in strategically important sectors. But the breadth of factory growth remains limited: consumer goods output declined, nondurables weakened across most categories, and factory utilization was little changed. Overall, the production data fit the broader pattern of the report — activity is still expanding in select investment-heavy areas, but the industrial base remains uneven, cost sensitive, and exposed to supply chain stress, war-related disruptions, and rising input prices.
The latest Beige Book reinforces the broader picture of an economy still expanding modestly, but with a more cautious tone beneath the surface. Most Federal Reserve districts reported slight to moderate growth, and manufacturing stood out as a relative bright spot, supported by defense activity, data-center demand, and selective hiring in industrial sectors. But that strength remains narrow rather than broad-based, and other parts of the report point to growing strains: consumer spending is increasingly split by income, with higher-income households still spending while middle- and lower-income consumers become more price-sensitive; loan delinquencies have risen in several categories; and businesses remain focused on protecting margins as energy costs ripple through shipping, packaging, groceries, and other inputs. Employment conditions also remain subdued, with most districts describing a low-hire, low-fire environment in which firms fill only critical roles and workers are less willing to change jobs amid uncertainty. Overall, the Beige Book supports the view that the economy remains resilient enough to keep the Fed from cutting rates immediately, but not strong enough to rule out easing later if consumer stress, credit deterioration, and business caution continue to build.
The monetary policy backdrop has turned decidedly more hawkish, even as the most likely near-term outcome remains an extended pause rather than an immediate rate increase. The Federal Reserve left its benchmark rate unchanged in June, but the updated projections showed a committee more divided and more concerned about inflation than it had been earlier in the year, with officials raising their core inflation forecast and marking down growth slightly. The statement also shifted in tone, emphasizing price stability, solid activity, strong productivity and capital investment, and inflation pressures tied partly to energy and other supply shocks. Warsh’s first meeting as Fed chair reinforced that message: his press conference was notably focused on price stability, and the Fed’s communications have moved steadily in a more hawkish direction since early 2026. At the same time, Warsh’s decision not to submit a dot-plot projection, along with his stated preference for less forward guidance, introduces a new uncertainty around how much information markets will receive about the likely path of policy. For now, the Fed appears inclined to stay on hold while it waits to see whether energy-driven inflation fades and whether labor-market conditions soften more materially, leaving policy restrictive but not yet moving decisively toward either hikes or cuts.
Fiscal, trade, and affordability policy are becoming a larger source of macro uncertainty, even as the administration presents tax cuts, deregulation, and energy production as offsets to higher living costs. The debt ceiling is already back on the horizon after last year’s increase, with federal debt projected to rise further above GDP and annual deficits remaining politically salient.
At the same time, the White House’s affordability agenda has struggled to gain traction: housing legislation has stalled, efforts to cap credit-card interest rates have met resistance, and executive actions on mortgage access and builder regulation appear likely to have only limited near-term effects. Those difficulties have been compounded by the Iran conflict, which pushed gasoline and mortgage costs higher, weakened the spring housing market, and muted attempts to highlight tax refunds, drug price negotiations, and other pocketbook measures. Trade policy remains similarly unsettled after the Supreme Court rejected the administration’s sweeping global tariffs, prompting a recent shift toward more targeted tools such as Section 301 investigations while preserving broad discretion through exemptions and inclusions. The result is an uneven and unpredictable tariff map, with some smaller economies gaining relief, others facing higher burdens, and major partners still exposed to renegotiation risk or sector-specific duties. Overall, the policy environment is simultaneously stimulative, protectionist, and fiscally strained: tax relief and deregulation may support demand at the margin, but debt-limit politics, tariff uncertainty, affordability pressures, and volatile energy costs continue to weigh on confidence, business planning, and the durability of the expansion.
All together, the May/June US economic data reveal an economy that is still expanding, but with a narrower and more fragile foundation than the headline figures imply. Consumer spending and selected areas of manufacturing remain resilient, labor conditions have stabilized, and investment tied to data centers, defense, and business equipment continues to provide support. But inflation pressures have not fully cleared the pipeline, service demand looks less firm, lower-income households are under strain, firms are cautious about hiring and capex, and policy uncertainty has become a larger drag on confidence and planning for households and firms alike. The near-term outlook is therefore cautiously positive but increasingly conditional: growth can continue if energy pressures fade, consumers remain employed, and investment momentum holds, but the economy is becoming more vulnerable to shocks from inflation, tariffs, credit stress, or policy missteps.
LEADING INDICATORS
ROUGHLY COINCIDENT INDICATORS


LAGGING INDICATORS


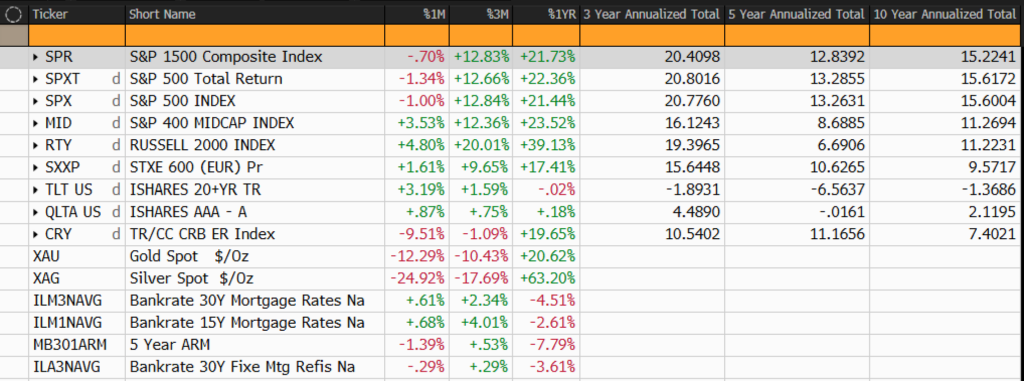
CAPITAL MARKETS PERFORMANCE